Hi Guangshan,
(I'm referring to
http://www.ncl.ucar.edu/Applications/Scripts/color_7.ncl for the following)
abs_zm = dim_avg(ABS) ; compute zonal mean for ABS = (lat,lon)
do gg = 0,dimsizes(ABS&lat)-1 ; subtract zonal mean from ABS
ABS(gg,:) = (/ ABS(gg,:) - abs_zm(gg) /)
end do
delete(abs_zm)
The above will remove the zonal mean from the ABS array.
Hope that helps,
Adam
Guangshan chen wrote:
> Dear all,
>
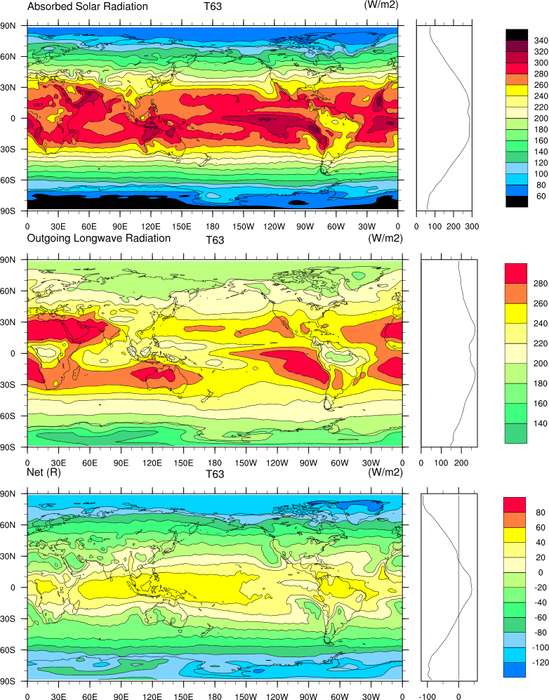
> I want to plot a figure like the example on this page
> http://www.ncl.ucar.edu/Applications/Images/color_7_lg.png
> But I want to change contour map from showing the original value to
> showing the value removed Zonal mean.
>
> Is there a easy way to do so?
>
> Thanks in advance
>
> Guangshan
>
> _______________________________________________
> ncl-talk mailing list
> ncl-talk_at_ucar.edu
> http://mailman.ucar.edu/mailman/listinfo/ncl-talk
--
--------------------------------------------------------------
Adam Phillips			             asphilli_at_ucar.edu
National Center for Atmospheric Research   tel: (303) 497-1726
ESSL/CGD/CAS                               fax: (303) 497-1333
P.O. Box 3000
Boulder, CO 80307-3000	  http://www.cgd.ucar.edu/cas/asphilli
_______________________________________________
ncl-talk mailing list
ncl-talk_at_ucar.edu
http://mailman.ucar.edu/mailman/listinfo/ncl-talk
Received on Wed Oct 24 2007 - 16:31:51 MDT
This archive was generated by hypermail 2.2.0 : Fri Oct 26 2007 - 09:29:31 MDT