HI Folks:
How can I specify the X-axis in date/time?
I mean can we change the tick marks in X-axis from 0, 1,2,3.....
To:
Jan 01, Jan 10, Jan 20........
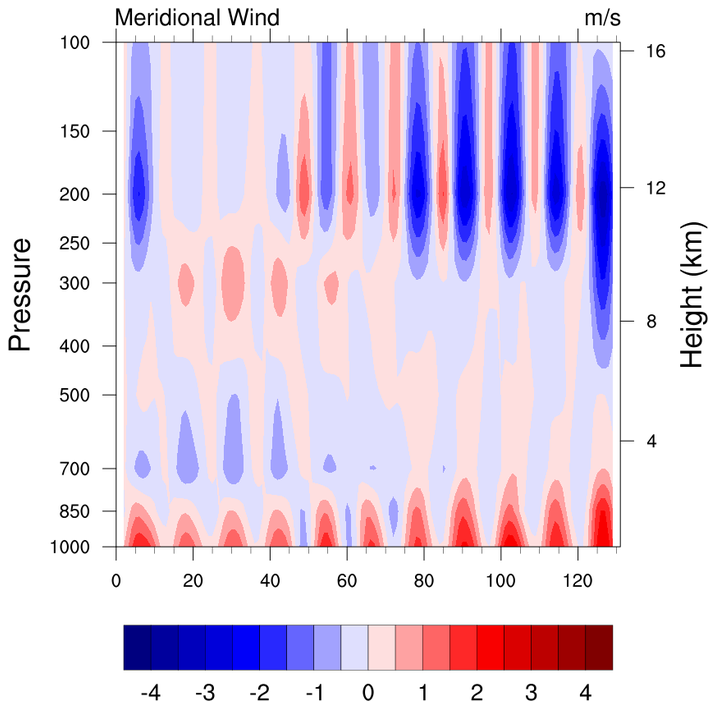
You can see examples here:
<http://www.ncl.ucar.edu/Applications/Images/h_time_3_lg.png>
Code here:
<http://www.ncl.ucar.edu/Applications/Scripts/h_time_3.ncl>
In this example, the time goes from 0 to 120. Could we specify the tick
marks with something else?
Thanks,
Yi
_______________________________________________
ncl-talk mailing list
ncl-talk_at_ucar.edu
http://mailman.ucar.edu/mailman/listinfo/ncl-talk
Received on Thu Jan 17 2008 - 18:46:28 MST
This archive was generated by hypermail 2.2.0 : Wed Jan 23 2008 - 14:19:33 MST