Date: Wed Feb 10 2010 - 10:37:14 MST
Hi Wolfgang,
There's no resource that you can set to fill the area you're talking
about.
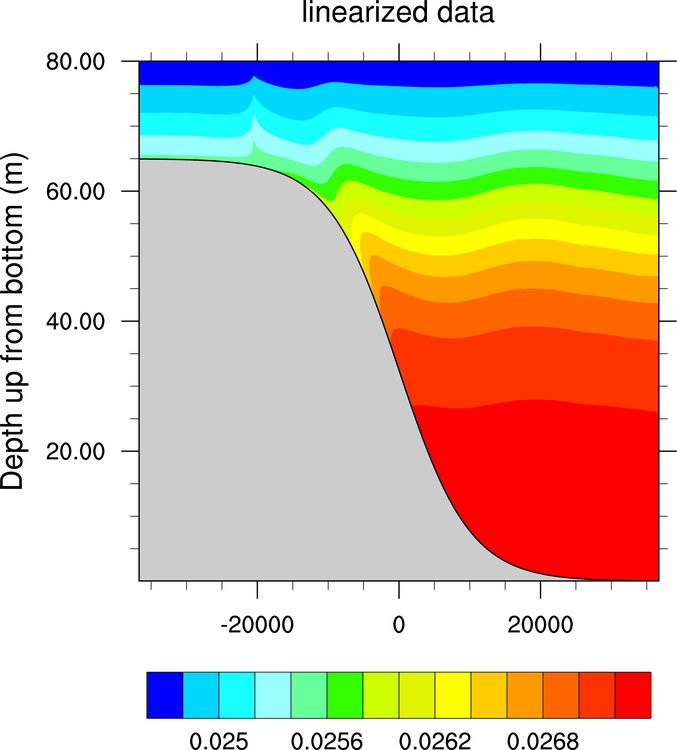
As you pointed out, these are not missing values, but rather, locations
where your data grid is not defined.
To fill this area, I believe the only way you can do this is with
gsn_add_polygon.
Please see attached script and example PNG. Is this what you're
looking for?
I filled in the area and outlined the boundary between the data
(using gsn_add_polyline).
--Mary
On Feb 9, 2010, at 6:07 AM, Wolfgang Langhans wrote:
> Hi,
>
> How can I shade the topography in the second example given at:
>
> http://www.ncl.ucar.edu/Applications/Scripts/2dvertcoords_1.ncl
>
> Setting the color for missing values using
>
> res@cnMissingValFillPattern= "SolidFill"
> res@cnMissingValFillColor = "gray"
>
> did not work out, since there are of course no actual missing values,
> but the linearization creates the underlying white topography. It
> would
> also be nice to know how I can only indicate the boundary (the
> surface)
> between missing values and data.
> Thanks for any help!
>
> Kind regards,
> Wolfgang
>
>
>
>
> --
> ************************************************
> Wolfgang Langhans
>
> Institute for Atmospheric and Climate Science
> ETH Zürich
> Universitätstrasse 16
> CH-8092 Zürich, Switzerland
>
> e-mail: wolfgang.langhans@env.ethz.ch
> phone : +41 44 632 78 18
> fax : +41 44 632 13 11
> room : CHN L16.3
> web : http://www.iac.ethz.ch/people/wolangha
> ************************************************
>
>
> _______________________________________________
> ncl-talk mailing list
> List instructions, subscriber options, unsubscribe:
> http://mailman.ucar.edu/mailman/listinfo/ncl-talk
_______________________________________________
ncl-talk mailing list
List instructions, subscriber options, unsubscribe:
http://mailman.ucar.edu/mailman/listinfo/ncl-talk
- application/octet-stream attachment: 2dvertcoords_1.ncl