Date: Wed Mar 10 2010 - 11:27:00 MST
Hi. How can I use "2" different color bars in a panel plot? Its not
clear from the examples.
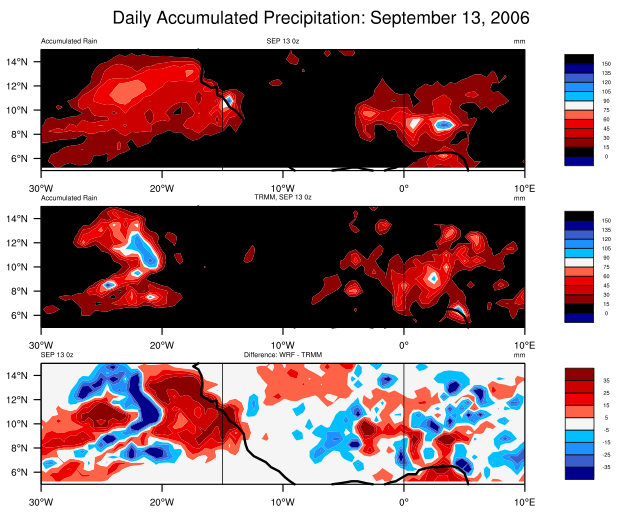
I am currently plotting 3-panel plot. I'm plotting modeled daily
accumulated rain in the first plot and observed daily accumulated rain
in the 2nd plot. These 2 will use the same color table. But I am
plotting the difference between the two in the 3rd plot and this needs
to use a different color table, that I explicitly make, because the
first color table will not work.
My problem is that the 3rd color table takes over the first color
table properties and my plot looks wrong.
Is there an example that tackles this already?
How can I change this?
-Erik
Code: plotting begins after "Create Precipitation Plots"
;;;;;;;;;;;;;;;;;;;;;;;;;;;;;;;;;;;;;;
load "$NCARG_ROOT/lib/ncarg/nclscripts/csm/gsn_code.ncl"
load "$NCARG_ROOT/lib/ncarg/nclscripts/csm/gsn_csm.ncl"
load "$NCARG_ROOT/lib/ncarg/nclscripts/csm/contributed.ncl"
load "$NCARG_ROOT/lib/ncarg/nclscripts/wrf/WRF_contributed.ncl"
load "$NCARG_ROOT/lib/ncarg/nclscripts/wrf/WRFUserARW.ncl"
load "$NCARG_ROOT/lib/ncarg/nclscripts/wrf/WRFUserARW_add.ncl"
;;;;;;;;;;;;;;;;;;;;;;;;;;;;;;;;;;;;;
; Plot name
wks = gsn_open_wks("ps","WRF_FNL_0913_Precip_ColdStart")
diri= "./"; input directory
fils= systemfunc ("ls "+diri+"wrfout*") ; file paths
setfileoption("nc","SuppressClose",False); needed to prevent crashing
of program
numFILES = dimsizes(fils)
do ff = 0,numFILES-1
fils(ff) = fils(ff)+".nc"
end do
print("numFILES = " + numFILES)
thetimes = new(numFILES,integer)
print(fils)
f = addfiles (fils, "r")
;;;;;;;;;;;;;;;;;;;;;;;;;;;;; Observations and Reanalysis;;;;;;
diri_trmm ="/Volumes/RunDIR_DataDIR_Terabyte/DATA/Precipitation_Observations/TRMM3B42/A_Interpolated/"
file_trmm = "TRMM_Daily_PrecipTotals_200609_05x05.nc"
;Observations
obs = addfile(diri_trmm+file_trmm,"r")
rain_trmm = obs->daily_accum
rain_TRMM = rain_trmm(:,{-15:30},{-30:30})
printVarSummary(rain_TRMM)
;;;;;;;;;;;;;;;;;;;;WRF Variables;;;;;;;;;;;;;;;;;;;;;;;;;;;;;;;;;;;;;;
rainnc = wrf_user_getvar_from_files(fils,"RAINNC",-1,True)
rainc = wrf_user_getvar_from_files(fils,"RAINC",-1,True)
lat = wrf_user_getvar_from_files(fils,"XLAT",-1,True)
lon = wrf_user_getvar_from_files(fils,"XLONG",-1,True)
;;;;;;;;;;;;;;;;;;;;;;;;;;;;;;; Calculate total rainfall (convective +
non-convective)
rain = rainc+rainnc
rain = where(rain.lt.0.0 , 0.0, rain); set NANS to 0
dimt = dimsizes(rain)
nhr = 8 ; 3 hourly files, 8 = day
ntim = dimt(0) ; From Earlier
daily_rain = new((/((ntim-1)/nhr),dimt(1),dimt(2)/),float,-9999)
prate = new((/((ntim-1)/nhr),dimt(1),dimt(2)/),float,-9999)
ntStrt = 0
ntLast = 8
do nt=0,ntim-1,8
print("the time "+nt)
print(nt/nhr+": ntLast - ntStart = "+ntLast+" - "+ntStrt)
daily_rain(nt/nhr,:,:) = rain(ntLast,:,:)-rain(ntStrt,:,:)
prate(nt/nhr,:,:)=daily_rain/8 ; mm/3hr
ntStrt = ntStrt + nhr
ntLast = ntLast + nhr
end do
; Meta Data
copy_VarMeta(rainc,daily_rain)
daily_rain@description="Accumulated Rain"
; take care of lats and lons for rain
coord_lat = lat(0,:,0)
coord_lon = lon(0,0,:)
daily_rain&south_north = coord_lat
daily_rain&west_east = coord_lon
printVarSummary(prate)
printMinMax(prate,True)
dimr=dimsizes(daily_rain)
rr=daily_rain/dimr(0) ; Another way to get rate/day (for climate purposes)
printMinMax(rr,True)
Prate = prate/3 ; mm/hr
copy_VarMeta(daily_rain,Prate)
Prate@description="Rain Rate"
Prate@units="mm/hr"
printVarSummary(Prate)
printMinMax(Prate,True)
delete(rain)
delete(rainc)
delete(rainnc)
delete(coord_lat)
delete(coord_lon)
;;;;;;; Zoom into region of interest;;;;;;;
a = addfile(fils(0),"r")
lats = (/ 5.0, 15.0 /)
;lons = (/ -30.0, 10.0 /)
lons = (/ -30.0, 10.5 /) ; for purposes of matching up the wrf
dimensions with observations
loc_zoom = wrf_user_latlon_to_ij(a, lats, lons)
print(loc_zoom)
y_start = loc_zoom(0,0)
y_end = loc_zoom(1,0)
x_start = loc_zoom(0,1)
x_end = loc_zoom(1,1)
;;;;;;;;;;; Rain Zoom ;;;;;;;;;;;;;;
daily_rain_zoom = daily_rain(:,y_start:y_end,x_start:x_end) ; Zoom for
daily rain
copy_VarMeta(daily_rain,daily_rain_zoom)
printVarSummary(daily_rain_zoom)
printMinMax(daily_rain_zoom,True)
lat_zoom = lat(::9,y_start:y_end,x_start:x_end)
lon_zoom = lon(::9,y_start:y_end,x_start:x_end)
printVarSummary(lat_zoom)
printVarSummary(lon_zoom)
coord_lat = lat_zoom(0,:,0)
coord_lon = lon_zoom(0,0,:)
daily_rain_zoom&south_north = coord_lat
daily_rain_zoom&west_east = coord_lon
Prate_zoom = Prate(:,y_start:y_end,x_start:x_end) ; Zoom for Prate
copy_VarMeta(Prate,Prate_zoom)
Prate_zoom&south_north = coord_lat
Prate_zoom&west_east = coord_lon
;;;;;TRMM region
trmm = rain_TRMM(:,{5:15},{-30:10})
printVarSummary(trmm)
;;;
diff = daily_rain_zoom(0,:,:) - trmm(11,:,:) ; WRF precip minus TRMM estimates
printVarSummary(diff)
copy_VarCoords(daily_rain_zoom(0,:,:),diff)
;================================================================================
; Create precipitation plots
;================================================================================
plot = new(3,graphic)
res = True
res@gsnFrame = False ; don't draw yet
res@gsnDraw = False ; don't advance frame yet
;============================= ;Zoom part
res@gsnAddCyclic = False
res@mpLimitMode = "Corners"
res@mpLeftCornerLatF = -15
res@mpLeftCornerLonF = -30
res@mpRightCornerLatF = 30
res@mpRightCornerLonF = 30
;============================ ;Map details
res@mpFillOn = False
res@mpGeophysicalLineColor = "Black"
res@mpGeophysicalLineThicknessF = "4.0"
res@mpNationalLineColor = "Black"
res@pmTickMarkDisplayMode = "Always" ; Toggle b/t these two for
tick mark effect
res@mpGridAndLimbOn = True
res@lbOrientation = "Vertical" ; vertical label bar
pres1 = res
gsn_define_colormap(wks,"BlAqGrYeOrRe") ; choose colormap
pres1@cnFillOn = True ; turn on color fill
pres1@gsnSpreadColors = True ; use full range of colors
pres1@cnLinesOn = False ; turn off contour lines
pres1@cnLineLabelsOn = False ; turn off line labels
pres1@gsnAddCyclic = False
pres1@mpLimitMode = "Corners"
pres1@mpLeftCornerLatF = 5
pres1@mpLeftCornerLonF = -30
pres1@mpRightCornerLatF = 15
pres1@mpRightCornerLonF = 10
pres1@cnLevelSelectionMode = "ManualLevels" ; set manual contour levels
pres1@cnMinLevelValF = 0.
pres1@cnMaxLevelValF = 150.
pres1@cnLevelSpacingF = 15.
pres1@gsnLeftString = "Accumulated Rain"
pres1@gsnCenterString = "SEP 13 0z"
pres1@gsnRightString = "mm"
plot = gsn_csm_contour_map_ce(wks,daily_rain_zoom(0,:,:),pres1)
;TRMM Plot
pres1@cnLevelSelectionMode = "ManualLevels" ; set manual contour levels
pres1@cnMinLevelValF = 0.
pres1@cnMaxLevelValF = 150.
pres1@cnLevelSpacingF = 15.
pres1@gsnLeftString = "Accumulated Rain"
pres1@gsnCenterString = "TRMM, SEP 13 0z"
pres1@gsnRightString = "mm"
plot(1) = gsn_csm_contour_map_ce(wks,trmm(11,:,:),pres1)
;Plot Difference Precipitation
pres = res
; Color (/"background","foreground","first color","second color",..etc...,
colors = (/"white","black" \
,"blue4","royalblue3","dodgerblue1","deepskyblue" \
,"whitesmoke","tomato","red2","red3","red4"/)
gsn_define_colormap(wks, colors) ; generate new color map
;pres@gsnFrame = False ; don't draw yet
;pres@gsnDraw = False ; don't advance frame yet
pres@cnFillOn = True ; color plot desired
pres@cnLineLabelsOn = False ; turn off contour lines
pres@cnFillMode = "AreaFill" ; Raster Mode ,could
use "CellFill"
pres@cnLinesOn = False ; turn of contour lines
;res@cnLineLabelsOn = False ; Turn off contour lines lables
;res@cnLineLabelsOn = True
pres1@gsnAddCyclic = False
pres@mpLimitMode = "Corners"
pres@mpLeftCornerLatF = 5
pres@mpLeftCornerLonF = -30
pres@mpRightCornerLatF = 15
pres@mpRightCornerLonF = 10
pres@cnLevelSelectionMode = "ExplicitLevels"
pres@cnLevels = (/-35,-25,-15,-5,5,15,25,35/) ; "mm"
pres@cnMissingValFillPattern = 0
pres@cnMissingValFillColor = "black"
pres@gsnLeftString = "SEP 13 0z"
pres@gsnCenterString = "Difference: WRF - TRMM"
pres@gsnRightString = "mm"
plot(2) = gsn_csm_contour_map_ce(wks,diff,pres) ;works
;************************************************
; create panel
;************************************************
resP = True ; modify the panel plot
resP@txString = "Daily Accumulated Precipitation:
September 13, 2006"
gsn_panel(wks,plot,(/3,1/),resP) ; now draw as one plot
_______________________________________________
ncl-talk mailing list
List instructions, subscriber options, unsubscribe:
http://mailman.ucar.edu/mailman/listinfo/ncl-talk