Hi Mary,
A section of my NCL script is as follows:
; Set pointers to wrf output files
var1 = "TT" ; var to process
var2 = "TT" ; forcing var to process
varName0 = "T_p"
varName1 = "TT"
f0 = addfile(dstr0+csho0+"_"+var1+".nc","r") ; wrfpost var output
file
f1 = addfile(dstr1+csho1+"_"+var1+".nc","r") ; wrfpost var output
file
f2 = addfile(dstr2+csho2+"_"+var1+".nc","r") ; wrfpost var output
file
f3 = addfile(dstr3+csho3+"_"+var1+".nc","r") ; wrfpost var output
file
; g =
addfile(ifor+"met_em.d01.2007-"+mo(n)+"_"+var2+".nc","r") ;
forcing var output file
; Get times for each of the files
TimeChar = f0->time
year = f0->year
month = f0->month
day = f0->day
hour = f0->hour
minute = f0->minute
month_h = month(::4)
day_h = day(::4)
print(year + "_" + month + "_" + day + "_" + hour + "_" + minute)
DimTimeChar = dimsizes(TimeChar)
print("TimeChar dimsizes:" + DimTimeChar)
nTime = TimeChar(:) ; 1=00Z
nTimes = dimsizes(TimeChar) - 1
print("nTime:" + nTime + "and nt: " + nTimes)
;
; Set basic attributes
latt = f0->lat
lat = latt(:,0)
lat!0 = "lat"
lonn = f0->lon
lon = lonn(0,:)
lon!0 = "lon"
lat2d = f0->lat(:,:)
lon2d = f0->lon(:,:)
;
; Begin processing
f_var0 = f0->$varName0$(:,:,:,:)
f_var1 = f1->$varName0$(:,:,:,:)
f_var2 = f2->$varName0$(:,:,:,:)
f_var3 = f3->$varName0$(:,:,:,:)
f_var0!0 = "time"
f_var0!1 = "pressure"
f_var0!2 = "lat"
f_var0!3 = "lon"
f_var1!0 = "time"
f_var1!1 = "pressure"
f_var1!2 = "lat"
f_var1!3 = "lon"
f_var2!0 = "time"
f_var2!1 = "pressure"
f_var2!2 = "lat"
f_var2!3 = "lon"
f_var3!0 = "time"
f_var3!1 = "pressure"
f_var3!2 = "lat"
f_var3!3 = "lon"
;
; Daily average
f_day = f_var0(::4,:,:,:) ; trick
ntJump = 4 ; 6-hr step
ntStrt = 0 ; start at 0 time
ntLast = ntJump-1 ; end every 4 steps
if (mo(n) .eq. "12") then ; fix for early december cut-off
nTimes = nTimes-3
else
nTimes = nTimes
end if
do na=0,nTimes,4
f_day(na/4,:,:,:) = (
dim_avg_Wrap(f_var0(pressure|:,lat|:,lon|:,time|ntStrt:ntLast)) + \
dim_avg_Wrap(f_var1(pressure|:,lat|:,lon|:,time|ntStrt:ntLast)) + \
dim_avg_Wrap(f_var2(pressure|:,lat|:,lon|:,time|ntStrt:ntLast)) + \
dim_avg_Wrap(f_var3(pressure|:,lat|:,lon|:,time|ntStrt:ntLast)) )/4
ntStrt = ntStrt+ntJump
ntLast = ntLast+ntJump
end do
f_day = f_day - 273.15 ; convert to degC
delete(f_var0)
delete(f_var1)
delete(f_var2)
delete(f_var3)
delete(ntStrt)
delete(ntLast)
printVarSummary(f_day)
;
; Monthly average
f_mon = dim_avg_Wrap(f_day(pressure|:,lat|:,lon|:,time|:))
f_mon@lat2d = lat2d
f_mon@lon2d = lon2d
printVarSummary(f_mon)
;
; Calculate great circle and transect
llat = lat2d(60,62)
rlat = lat2d(55,77)
llon = lon2d(60,62)
rlon = lon2d(55,77)
npts = 10
dist = gc_latlon(llat,llon,rlat,rlon,npts,-2)
points = ispan(0,npts-1,1)*1.0
xgrid = rcm2rgrid(lat2d,lon2d,f_mon,lat,lon,0)
xgrid!0 = "pressure"
xgrid!1 = "lat"
xgrid!2 = "lon"
xgrid&lat = lat
xgrid&lon = lon
xgrid@_FillMissing = -999999
printVarSummary(xgrid)
trans = linint2_points(xgrid&lat,xgrid&lon,xgrid,False,dist@gclon
,dist@gclat,0)
copy_VarAtts(f_mon,trans)
printVarSummary(trans)
exit
The script fails at the line where the transect variable, trans, is defined
with the following error:
fatal:linint2_points: The rightmost dimensions of fi must be nyi x nxi,
where nyi and nxi are the lengths of yi and xi respectively
fatal:Execute: Error occurred at or near line 174 in file
ensave_trans_profile.ncl
Some print output of the variables before the transect is being taken:
Variable: f_mon
Type: float
Total Size: 337500 bytes
84375 values
Number of Dimensions: 3
Dimensions and sizes: [pressure | 5] x [lat | 135] x [lon | 125]
Coordinates:
pressure: [1000..300]
lat: [0..134]
lon: [0..124]
Number Of Attributes: 9
lon2d : <ARRAY of 16875 elements>
lat2d : <ARRAY of 16875 elements>
long_name : Temperature at Pressure Levels
standard_name : air_temperature
units : K
_FillValue : -999999
missing_value : -999999
coordinates : lon lat
average_op_ncl : dim_avg over dimension: time
Variable: xgrid
Type: float
Total Size: 337500 bytes
84375 values
Number of Dimensions: 3
Dimensions and sizes: [pressure | 5] x [lat | 135] x [lon | 125]
Coordinates:
lat: [49.83952..51.32257]
lon: [137.6907..-138.8663]
Number Of Attributes: 2
_FillMissing : -999999
_FillValue : -999999
-------------------------------------------------------------
Brandon Fisel
On Thu, Mar 4, 2010 at 10:30, Mary Haley <haley@ucar.edu> wrote:
> Brandon,
>
> Exactly what errors do you get?
>
> --Mary
>
> On Mar 1, 2010, at 3:25 PM, Brandon Fisel wrote:
>
> NCL Help,
>
> I'm interested in plotting monthly averaged vertical temperature profiles
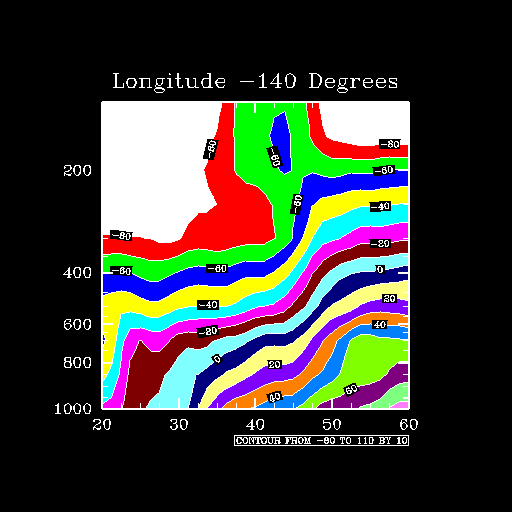
> for each lon in my domain. The variable I am trying to plot is a 3D variable
> (pressure,lat,lon). I would like for it to look similar to
> http://www.ncl.ucar.edu/Applications/BasicExamples/Contour/cn08.gif. I've
> tried using that example, however I always receive errors doing so.
>
> Attached is the my .ncl file.
>
>
> -------------------------------------------------------------
> Brandon Fisel
> <plot_profile.ncl.txt>
> _______________________________________________
> ncl-talk mailing list
> List instructions, subscriber options, unsubscribe:
> http://mailman.ucar.edu/mailman/listinfo/ncl-talk
>
>
>
Received on Tue Mar 9 15:55:29 2010
This archive was generated by hypermail 2.1.8 : Thu Mar 11 2010 - 11:17:07 MST