Date: Tue Mar 09 2010 - 14:38:08 MST
Could anybody please help me with a simple histogram plot? My code is:
; - Drawing a histogram using discrete bin values
;
load "$NCARG_ROOT/lib/ncarg/nclscripts/csm/gsn_code.ncl"
begin
x = new(32,integer)
do i=0,dimsizes(x)-1
x(i) = i
end do
fl_y_axes="y_zhou.dat"
data_y = asciiread(fl_y_axes,32,"float")
; x_short = x
; qsort(x)
wks = gsn_open_wks("eps","histo") ; open workstation
gsn_define_colormap(wks,"temp1") ; choose colormap
res = True
res@tmXBLabelStride = 2 ; every other x-label
; res@gsnHistogramDiscreteBinValues = ispan(0,31,1)
plot=gsn_histogram(wks,data_y,res)
end
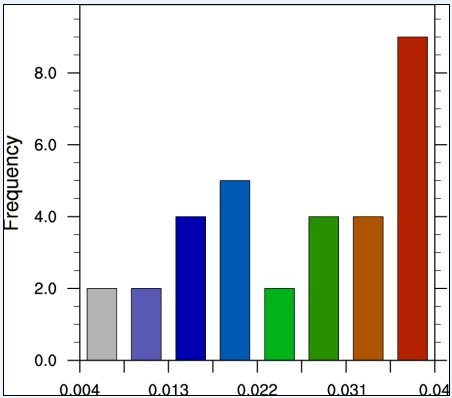
The graph I got is like:
[image:
?ui=2&view=att&th=12744d92ab56da93&attid=0.1&disp=attd&realattid=ii_12744d92ab56da93&zw]
But my data have 32 numbers, I hope thse values are shown as y-axes,
0.008376069
0.010610765
0.011429693
0.013173127
0.015046932
0.020174555
0.021249746
0.027682315
0.028703543
0.032443662
0.033265491
0.034031743
0.036874688
0.036874688
0.037776984
0.037550021
0.037311347
0.036591564
0.036591564
0.035565244
0.035565244
0.032706172
0.030944882
0.029017013
0.024836748
0.022671116
0.020509536
0.018388382
0.018388382
0.016339395
0.014389086
0.006661787
Anyone please help fix it? Thank you!
--
Cordially,
Hongyan
_______________________________________________
ncl-talk mailing list
List instructions, subscriber options, unsubscribe:
http://mailman.ucar.edu/mailman/listinfo/ncl-talk