Date: Tue Apr 27 2010 - 04:17:25 MDT
Hi,
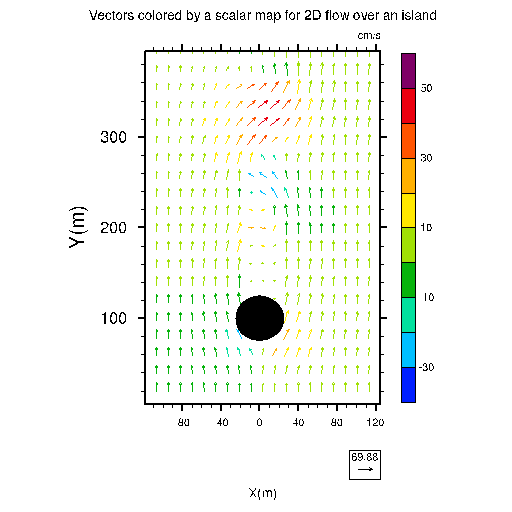
originally, I plotted a flow past cylinder with colored velocity vectors,
indicating its magnitude.
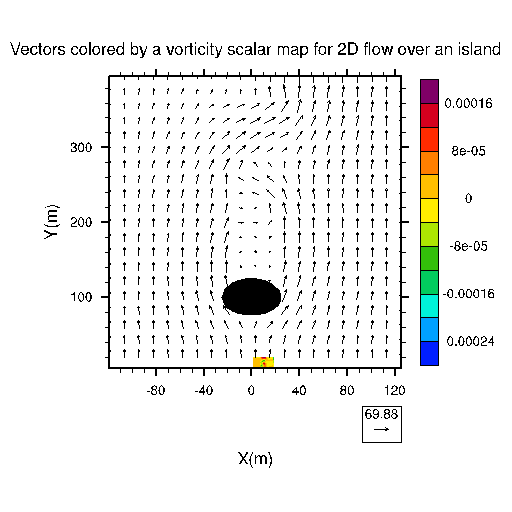
Now I wanted to show contours of its vorticity together with the velocity
contours. However, only a small portion of the color contours is shown. Can
you help to solve this problem?
Part of the code is:
u = short2flt(a->U(0,::4,1:81:4)) ;read in data
v = short2flt(a->V(0,::4,1:81:4))
vr = uv2vr_cfd (u,v,u&latitude,u&longtitude, 2) ;calculate vorticity
u&longtitude = -125+u&longtitude*250/82 ;grid shift
u&latitude = u&latitude*400/82
v&longtitude = -125+v&longtitude*250/82
v&latitude = v&latitude*400/82
wks = gsn_open_wks("x11","vvv")
gsn_define_colormap(wks,"BlAqGrYeOrReVi200") ; choose color map
vcres = True ; plot mods desired
vcres@cnFillOn = True ; turn on color for contours
vcres@cnLinesOn = False ; turn off contour lines
vcres@cnLineLabelsOn = False ; turn off contour line
labels
vcres@gsnScalarContour = True ; contours desired
vcres@gsnSpreadColors = True ; use full colormap
vcres@gsnSpreadColorEnd = 193 ; last color to use
vcres@gsnSpreadColorStart = 6 ; first color to use
vcres@lbLabelStride = 2 ; plot every other colar bar label
u&longtitude@units = "meters"
u&latitude@units = "meters"
vcres@mpMinLonF = -125. ; select a subregion
vcres@mpMaxLonF = 125.
vcres@mpMinLatF = 0.
vcres@mpMaxLatF = 400.
vcres@tiMainString = "Vectors colored by a vorticity scalar map
for 2D flow over an island"
vcres@tiYAxisString = "Y(m)"
vcres@tiXAxisString = "X(m)"
vcres@gsnAddCyclic=False
vcres@gsnMaximize = True
vcres@gsnDraw = False
vcres@gsnFrame = False
vcres@pmLegendDisplayMode = "Always" ; turn on legend
vcres@pmLegendSide = "Right"
vcres@vpWidthF = 1.
vcres@vpHeightF = 1.5
vcres@lbOrientation = "Vertical"
plot=gsn_csm_vector_scalar(wks,u,v,vr,vcres) ; create plot
gres = True
gres@gsFillColor = "black"
x_cir = new((/100/),float) ; allocate memory ;draw circle
y_cir = new((/100/),float) ; allocate memory
;draw circle
do i=0,49
x_cir(i)=-25+i*2*25./50.
end do
do i=50,99
x_cir(i)=25-(i-50)*2*25./50.
end do
do i=0,49
y_cir(i)=100.+sqrt(25.*25.-x_cir(i)*x_cir(i))
end do
do i=50,99
y_cir(i)=100.-sqrt(25.*25.-x_cir(i)*x_cir(i))
end do
dum = gsn_add_polygon(wks,plot,x_cir,y_cir,gres)
draw(plot)
frame(wks)
end
_______________________________________________
ncl-talk mailing list
List instructions, subscriber options, unsubscribe:
http://mailman.ucar.edu/mailman/listinfo/ncl-talk