Date: Tue Apr 27 2010 - 01:10:09 MDT
Dear NCL users,
I download GODAS monthly data from the website
"http://www.esrl.noaa.gov/psd/data/gridded/data.godas.html".
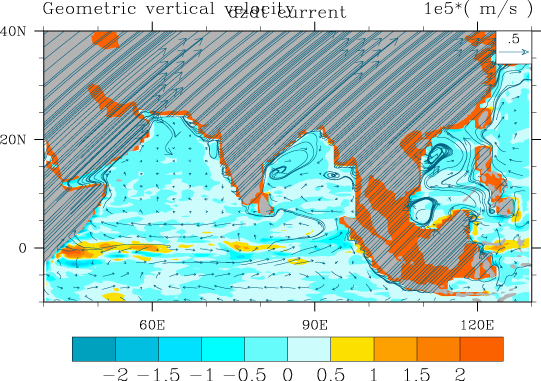
Draw the sea surface current over the dzdt, but the value over the land
can't be masked.
I think it's the problem of the missing value, delete the
"missing_value", but it still doesn't work.
Do you have any solution?
Thank you very much.
Regards
moon
NCL script follow example "godas_2.ncl" and figure output:
;--------------------------------------------------------------------------
diri = "../"
f1 = "dzdt.1998.nc"
f2 = "ucur.1998.nc"
f3 = "vcur.1998.nc"
pltType = "eps"
pltName = "test"
load "$NCARG_ROOT/lib/ncarg/nclscripts/csm/gsn_code.ncl"
load "$NCARG_ROOT/lib/ncarg/nclscripts/csm/gsn_csm.ncl"
load "$NCARG_ROOT/lib/ncarg/nclscripts/csm/contributed.ncl"
;************************************************
; MAIN
;************************************************
begin
;****************************************************
; Open GRIB file: For illustration
; (1) Force a time dimension [not required here]
; (2) Use 'coordinate subscripting' to import data at specific coords
;****************************************************
a = addfile(diri + f1, "r")
b = addfile(diri + f2, "r")
c = addfile(diri + f3, "r")
u = short2flt(b->ucur(:,{5},:,:)) ; global 5 meter u
v = short2flt(c->vcur(:,{5},:,:)) ; global 5 meter v
dzdt = short2flt(a->dzdt(:,{10},:,:)) ; 10 m the mixed layer depth
u@missing_value = u@_FillValue
v@missing_Value = v@_FillValue
dzdt@missing_Value = dzdt@_FillValue
delete(u@missing_value)
delete(v@missing_Value)
delete(dzdt@missing_Value)
;************************************************
wks = gsn_open_wks (pltType,pltName) ; open workstation
; choose colormap
gsn_define_colormap(wks,"nrl_sirkes") ; choose colormap
i = NhlNewColor(wks,0.7,0.7,0.7)
;****************************************************
; Regional Grids
;****************************************************
minLon = 40. ; select a subregion
maxLon = 130.
minLat = -10.
maxLat = 40.
res = True ; plot mods desired
res@gsnDraw = False ; don't draw
res@gsnFrame = False ; don't advance frame
res@gsnMaximize = True ; make ps, eps, pdf large
res@gsnPaperOrientation = "portrait" ; force portrait
res@mpLandFillColor = "grey" ; color of land
res@lbLabelAutoStride = True
res@cnFillOn = True ; turn on color for
contours
res@cnLinesOn = False ; turn off contour lines
res@cnLineLabelsOn = False ; turn off contour line
labels
res@gsnScalarContour = True ; contours desired
res@gsnAddCyclic = False ; regional plot
res@mpMinLonF = minLon ; select a subregion
res@mpMaxLonF = maxLon
res@mpMinLatF = minLat
res@mpMaxLatF = maxLat
res@lbLabelFontHeightF = 0.018
res@vcRefMagnitudeF = 0.5 ; define vector ref mag
res@vcMinDistanceF = 0.0185 ; thin out vectors
res@vcMonoLineArrowColor = "True"
res@vcLineArrowColor = "green"
res@vcRefLengthF = 0.045 ; define length of vec
ref
res@vcGlyphStyle = "CurlyVector" ; turn on curley
vectors
res@vcRefAnnoOrthogonalPosF = -1.00 ; move ref vector
res@gsnCenterString = "dzdt current "
res@cnLevelSelectionMode = "ManualLevels"
res@cnMinLevelValF = -2
res@cnMaxLevelValF = 2
res@cnLevelSpacingF = 0.5
res@cnFillColors = (/4,5,6,7,9,11,14,16,17,18,19,21/)
dzdt = dzdt*1e5 ; scale .... arbitrary .... nicer values
dzdt@units = "1e5*( "+dzdt@units+" )"
n=2
plot=gsn_csm_vector_scalar_map_ce(wks,u(n,{minLat:maxLat},{minLon:maxLon})
\
,v(n,{minLat:maxLat},{minLon:maxLon})
\
,dzdt(n,{minLat:maxLat},{minLon:maxLon})
, res)
draw(plot)
frame(wks)
end
-- ĘąÓĂ Opera ¸ďĂüĐԵĵç×ÓÓĘĽţżÍ»§łĚĐň: http://www.opera.com/mail/
_______________________________________________
ncl-talk mailing list
List instructions, subscriber options, unsubscribe:
http://mailman.ucar.edu/mailman/listinfo/ncl-talk