Date: Tue May 04 2010 - 08:12:53 MDT
Hi NCL list,
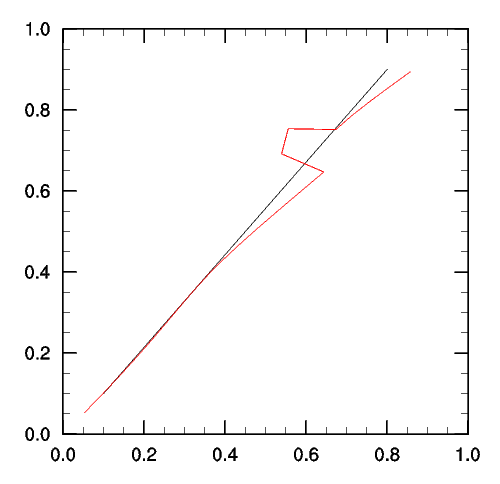
I am using the rcm2points interpolation routine to interpolate fields
from a curvilinear grid (lat/lon) to a list of specific locations given
in (lat/lon). Doing that, I've stumbled over a strange behaviour of the
rcm2points function. The NCL documentation page of rcm2points does not
specify what type of interpolation (bi-linear, nearest neighbour, ...)
rcm2points is supposed to do. I've attached an example script showing
the strange behaviour (see attached figure for output of script). In my
humble opinion, the output should be two almost identical lines (black
original, red interpolated). Even if rcm2points would do a nearest
neighbour interpolation, the resulting figure cannot really be
explained. The strange behaviour changes by increasing the number of
points in the mesh and disappears as a very large number of points is
used (e.g. s=(/100,100/) ).
Any ideas?
Cheers,
Oli
; *****************************************************************
; test script showing off rcm2points problem
begin
; define dimensions
s = (/4,4/) ; # points in mesh
np = 23 ; # points in line
; create regular mesh of unit square. the number of points
; used in each direction is specified by s
x = new(s,float)
do i=0,s(1)-1
x(:,i) = fspan(0.0,1.0,s(0))
end do
y = new(s,float)
do i=0,s(1)-1
y(i,:) = fspan(0.0,1.0,s(1))
end do
; create straight line of np points from (x,y) = (0.1,0.1) to (0.8,0.9)
p = new((/np,2/),float)
tmp = fspan(0.,1.,np)
p(:,0) = 0.1 + tmp*0.7
p(:,1) = 0.1 + tmp*0.8
delete(tmp)
; interpolate mesh coordinates to line position
; note: this should give back line
; note: in normal usage, the third argument of rcm2points would be any
field to interpolate
pi = p
pi(:,0) = rcm2points(x,y,x,p(:,0),p(:,1),1)
pi(:,1) = rcm2points(x,y,y,p(:,0),p(:,1),1)
; open graphic port
wks = gsn_open_wks("ps","int_problem")
; plot original/interpolated line
r = True
r@gsnDraw = False
r@gsnFrame = False
pl1 = gsn_xy(wks,p(:,0),p(:,1),r)
r@xyLineColor = "red"
pl2 = gsn_xy(wks,pi(:,0),pi(:,1),r)
; overlay
overlay(pl1,pl2)
draw(pl1)
frame(wks)
end
________________________________________
Oliver Fuhrer
Numerical Models
Federal Departement of Home Affairs FDHA
Federal Office of Meteorology and Climatology MeteoSwiss
Kraehbuehlstrasse 58, P.O. Box 514, CH-8044 Zurich, Switzerland
Tel. +41 44 256 93 59
Fax +41 44 256 92 78
oliver.fuhrer@meteoswiss.ch
www.meteoswiss.ch - First-hand information
_______________________________________________
ncl-talk mailing list
List instructions, subscriber options, unsubscribe:
http://mailman.ucar.edu/mailman/listinfo/ncl-talk