Date: Wed Jun 23 2010 - 05:15:55 MDT
*Dear NCL users.
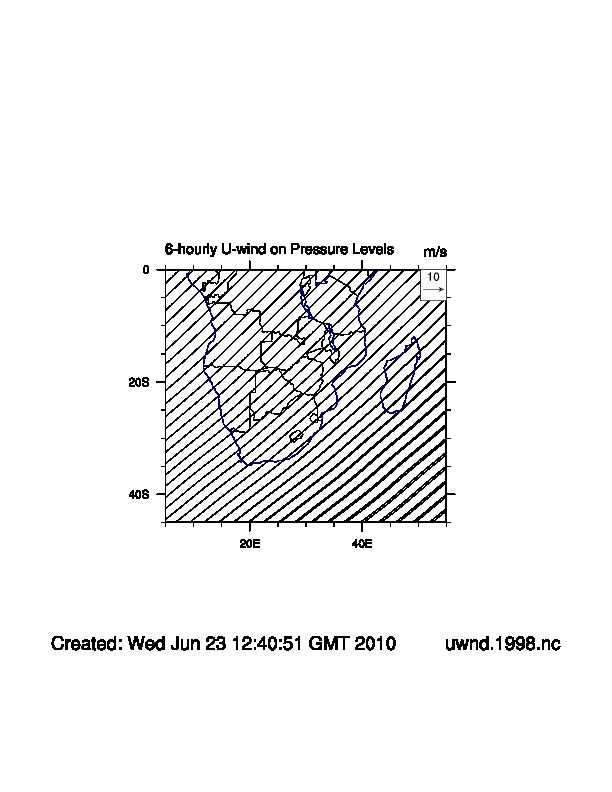
I am using this script to plot the wind vectors using ncep/reanalysis data
1998. I've tried to plot wind components, but in the plot they aren't going
the way that it should be. Something strange is happening.
Any help is strongly appreciated
Vp*
___________________________________________________________________________________
load "$NCARG_ROOT/lib/ncarg/nclscripts/csm/gsn_code.ncl"
load "$NCARG_ROOT/lib/ncarg/nclscripts/csm/gsn_csm.ncl"
load "$NCARG_ROOT/lib/ncarg/nclscripts/csm/contributed.ncl"
load "$NCARG_ROOT/lib/ncarg/nclscripts/csm/shea_util.ncl"
;************************************************
begin
;************************************************
; read in netCDF file
;************************************************
a = addfile("/uwnd.1998.nc","r")
print(a)
b = addfile("/vwnd.1998.nc","r")
;************************************************
; read in zonal [u] and meridional [v] winds (July)
;************************************************
u = a->uwnd(1,0,:,:)
v = b->vwnd(1,0,:,:) ; Get u, v, time (1),level (1000hpa),latitude(-90:90)
and longitude(0:360) data.
speed = sqrt(u^2+v^2)
printVarSummary(u)
printVarSummary(v)
;************************************************
; create plot
;************************************************
wks = gsn_open_wks("ps","vector_") ; open a ps file
vcres = True ; plot mods desired
vcres@gsnFrame = False ; so we can draw time
stamp
vcres@vcRefAnnoOrthogonalPosF = -1.0 ; move ref vector up
vcres@vcRefMagnitudeF = 10.0 ; define vector ref mag
vcres@vcRefLengthF = 0.045 ; define length of vec
ref
vcres@vcGlyphStyle = "CurlyVector" ; turn on curly vectors
vcres@vcMinDistanceF = 0.017
;************************************************
; Choose a subregion ou fazer zoom
;************************************************
vcres@mpFillOn = False ; turn off gray fill
vcres@mpOutlineBoundarySets = "National" ; turn on country
boundaries
vcres@mpGeophysicalLineColor = "Navy" ; color of cont. outlines
vcres@mpGeophysicalLineThicknessF = 1.5 ; thickness of outlines
vcres@mpMaxLatF = 0 ;maximum latitude
vcres@mpMinLatF = -45 ;minimum latitude
vcres@mpMaxLonF = 55 ;maximum longitude
vcres@mpMinLonF = 5 ;minimum longitude
vector = gsn_csm_vector_map_ce(wks,u,v,vcres)
;************************************************
; add time stamp to plot
;************************************************
infoTimeStamp(wks,0.025,"uwnd.1998.nc") ; arguments are workstation
; size of text desired, and
; right string.
frame (wks)
end
_______________________________________________
ncl-talk mailing list
List instructions, subscriber options, unsubscribe:
http://mailman.ucar.edu/mailman/listinfo/ncl-talk