Date: Wed Jun 30 2010 - 09:31:51 MDT
*Mary
This is my script and data *
load "$NCARG_ROOT/lib/ncarg/nclscripts/csm/gsn_code.ncl"
load "$NCARG_ROOT/lib/ncarg/nclscripts/csm/gsn_csm.ncl"
load "$NCARG_ROOT/lib/ncarg/nclscripts/csm/contributed.ncl"
load "$NCARG_ROOT/lib/ncarg/nclscripts/csm/shea_util.ncl"
;************************************************
begin
;************************************************
; read in netCDF file
;************************************************
a = addfile("/uwnd1998.nc","r")
print(a)
b = addfile("/vwnd1998.nc","r")
;************************************************
; read in zonal [u] and meridional [v] winds (July)
;************************************************
u = a->uwnd(0,0,:,:)
v = b->vwnd(0,0,:,:) ; Get u, v, time (1),level (1000hpa),latitude(-90:90)
and longitude(0:360) data.
speed = sqrt(u^2+v^2)
printVarSummary(u)
printVarSummary(v)
;************************************************
; create plot
;************************************************
wks = gsn_open_wks("ps","vector") ; open a ps file
gsn_define_colormap (wks,"BlAqGrYeOrRevi200") ; choose color map
vcres = True ; plot mods desired
vcres@gsnFrame = False ; so we can draw time
stamp
vcres@vcRefAnnoOrthogonalPosF = -1.0 ; move ref vector up
vcres@vcRefMagnitudeF = 10.0 ; define vector ref mag
vcres@vcRefLengthF = 0.00004 ; define length of vec
ref
vcres@vcGlyphStyle = "CurlyVector" ; turn on curly vectors
vcres@vcMinDistanceF = 0.017
;************************************************
; Choose a subregion
;************************************************
vcres@mpFillOn = False ; turn off gray fill
vcres@mpOutlineBoundarySets = "National" ; turn on country
boundaries
vcres@mpGeophysicalLineColor = "Navy" ; color of cont. outlines
vcres@mpGeophysicalLineThicknessF = 1.5 ; thickness of outlines
vcres@mpMaxLatF = 0 ;maximum latitude
vcres@mpMinLatF = -45 ;minimum latitude
vcres@mpMaxLonF = 55 ;maximum longitude
vcres@mpMinLonF = 5 ;minimum longitude
vector = gsn_csm_vector_map_ce(wks,u,v,vcres)
;************************************************
; add time stamp to plot
;************************************************
infoTimeStamp(wks,0.025,"uwnd.1998.nc") ; arguments are workstation
; size of text desired, and
; right string.
frame (wks)
end
*Thanks
Vishali P.
*
On Mon, Jun 28, 2010 at 11:19 PM, Mary Haley <haley@ucar.edu> wrote:
> Vishali,
>
> I don't think this is an NCL problem, but it would help if you could
> provide your script and data.
>
> --Mary
>
> On Jun 28, 2010, at 2:32 AM, Vishali P. wrote:
>
> Adam,
>
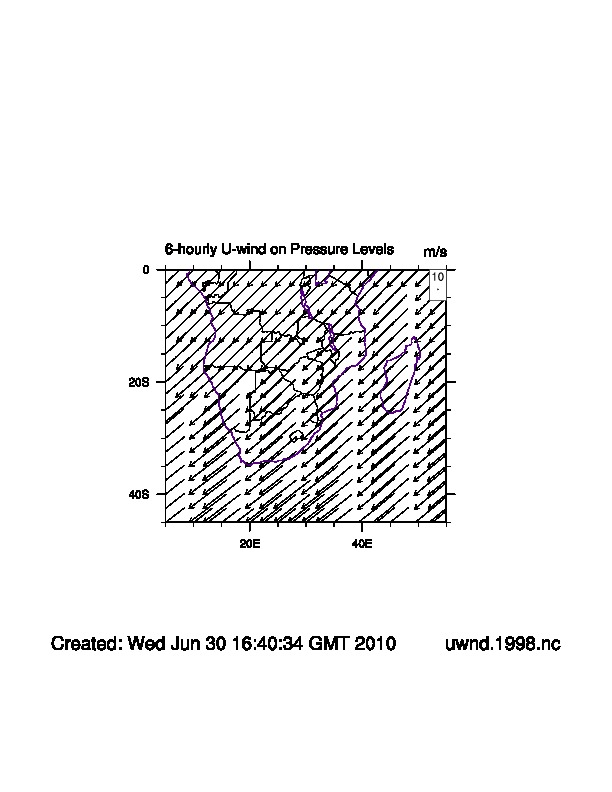
> Thanks for help, I've tried to change those values , and I even succeeded
> to cut, but the problem is that the vectors are going all to the same
> direction. I've also tried to not make zoom of the map, but there's no
> change on vectors direction (see "vector_2"). Is there any other solution?
>
> vcres@vcRefMagnitudeF = 10.0 ; define vector ref mag
> vcres@vcRefLengthF = 0.00004 ; define length of
> vec ref
>
>
> Please help
>
> Vishali P
>
>
>
>
> On Wed, Jun 23, 2010 at 2:48 PM, Adam Phillips <asphilli@ucar.edu> wrote:
>
>> VP,
>> vcres@vcRefMagnitudeF = 10.0 ; define vector ref mag
>> vcres@vcRefLengthF = 0.045 ; define length of vec
>>
>> I believe the curly vectors are being drawn, but they are too long. Try
>> adjusting the resources I pasted above downward.. At first guess I would
>> cut them in half... Let us know if you still can't figure it out... Adam
>>
>> > *Dear NCL users.
>> >
>> > I am using this script to plot the wind vectors using ncep/reanalysis
>> data
>> > 1998. I've tried to plot wind components, but in the plot they aren't
>> > going
>> > the way that it should be. Something strange is happening.
>> >
>> >
>> > Any help is strongly appreciated
>> >
>> > Vp*
>> >
>> >
>> ___________________________________________________________________________________
>> >
>> > load "$NCARG_ROOT/lib/ncarg/nclscripts/csm/gsn_code.ncl"
>> > load "$NCARG_ROOT/lib/ncarg/nclscripts/csm/gsn_csm.ncl"
>> > load "$NCARG_ROOT/lib/ncarg/nclscripts/csm/contributed.ncl"
>> > load "$NCARG_ROOT/lib/ncarg/nclscripts/csm/shea_util.ncl"
>> > ;************************************************
>> > begin
>> > ;************************************************
>> > ; read in netCDF file
>> > ;************************************************
>> > a = addfile("/uwnd.1998.nc","r")
>> > print(a)
>> > b = addfile("/vwnd.1998.nc","r")
>> > ;************************************************
>> > ; read in zonal [u] and meridional [v] winds (July)
>> > ;************************************************
>> > u = a->uwnd(1,0,:,:)
>> > v = b->vwnd(1,0,:,:) ; Get u, v, time (1),level
>> > (1000hpa),latitude(-90:90)
>> > and longitude(0:360) data.
>> >
>> > speed = sqrt(u^2+v^2)
>> >
>> > printVarSummary(u)
>> > printVarSummary(v)
>> >
>> > ;************************************************
>> > ; create plot
>> > ;************************************************
>> > wks = gsn_open_wks("ps","vector_") ; open a ps file
>> >
>> > vcres = True ; plot mods desired
>> > vcres@gsnFrame = False ; so we can draw
>> time
>> > stamp
>> > vcres@vcRefAnnoOrthogonalPosF = -1.0 ; move ref vector up
>> > vcres@vcRefMagnitudeF = 10.0 ; define vector ref
>> mag
>> > vcres@vcRefLengthF = 0.045 ; define length of
>> vec
>> > ref
>> > vcres@vcGlyphStyle = "CurlyVector" ; turn on curly
>> vectors
>> > vcres@vcMinDistanceF = 0.017
>> >
>> > ;************************************************
>> > ; Choose a subregion ou fazer zoom
>> > ;************************************************
>> > vcres@mpFillOn = False ; turn off gray fill
>> > vcres@mpOutlineBoundarySets = "National" ; turn on country
>> > boundaries
>> > vcres@mpGeophysicalLineColor = "Navy" ; color of cont.
>> > outlines
>> > vcres@mpGeophysicalLineThicknessF = 1.5 ; thickness of
>> outlines
>> >
>> > vcres@mpMaxLatF = 0 ;maximum latitude
>> > vcres@mpMinLatF = -45 ;minimum latitude
>> > vcres@mpMaxLonF = 55 ;maximum longitude
>> > vcres@mpMinLonF = 5 ;minimum longitude
>> >
>> > vector = gsn_csm_vector_map_ce(wks,u,v,vcres)
>> > ;************************************************
>> > ; add time stamp to plot
>> > ;************************************************
>> > infoTimeStamp(wks,0.025,"uwnd.1998.nc") ; arguments are
>> workstation
>> > ; size of text desired, and
>> > ; right string.
>> > frame (wks)
>> > end
>> > _______________________________________________
>> > ncl-talk mailing list
>> > List instructions, subscriber options, unsubscribe:
>> > http://mailman.ucar.edu/mailman/listinfo/ncl-talk
>> >
>>
>>
>>
> <vector_2.jpeg>_______________________________________________
>
> ncl-talk mailing list
> List instructions, subscriber options, unsubscribe:
> http://mailman.ucar.edu/mailman/listinfo/ncl-talk
>
>
>