Date: Wed Sep 15 2010 - 12:36:26 MDT
Hi,
This is a follow up case for below example:
http://www.ncl.ucar.edu/Support/talk_archives/2010/1904.html
I successfully read out lat and lon from that ASCII file. The size matches
and the value looks reasonable.
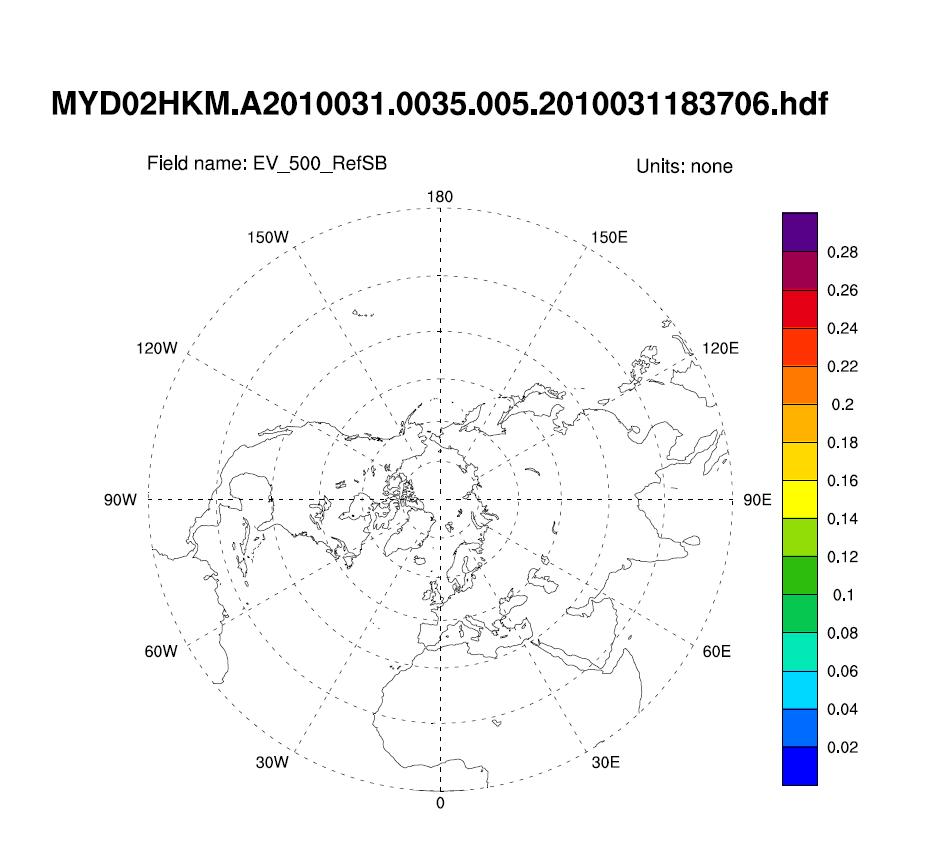
But the final pdf plot I got is blank. You can see title, map and color
bar well except data.
NCL code:
------------------------------------------------------------
load "$NCARG_ROOT/lib/ncarg/nclex/gsun/gsn_code.ncl"
load "$NCARG_ROOT/lib/ncarg/nclscripts/csm/gsn_csm.ncl"
begin
eos_file=addfile("MYD02HKM.A2010031.0035.005.2010031183706.hdf.he2", "r")
data_unscaled = eos_file->EV_500_RefSB_MODIS_SWATH_Type_L1B(0,:,:) ; get
the clues from print(eos_file)
data_unscaled@_FillValue = 65535h
data = 3.4915833E-5 * ( data_unscaled - (-0.0) )
nlon=4060
nlat=2708
lat=asciiread("lat_MYD02HKM.A2010031.0035.005.2010031183706.output",(/nlon,nlat/),"float")
lon=asciiread("lon_MYD02HKM.A2010031.0035.005.2010031183706.output",(/nlon,nlat/),"float")
data@lat2d=lat
data@lon2d=lon
xwks=gsn_open_wks("pdf","MYD02HKM.A2010031.0035.005.2010031183706_EV_500_RefSB.ncl")
setvalues NhlGetWorkspaceObjectId() ; make maximum filesize larger
"wsMaximumSize" : 200000000
end setvalues
res=True
res@cnFillOn=True
res@gsnMaximize=True
res@gsnPaperOrientation = "portrait"
res@cnLinesOn=False
res@cnLineLabelsOn = False
res@gsnSpreadColors=True
res@cnFillMode="RasterFill"
res@lbOrientation="vertical"
res@cnMissingValFillPattern = 0
res@cnMissingValFillColor=0
res@lbLabelAutoStride = True
res@sfXArray=lon
res@sfYArray=lat
res@gsnAddCyclic=False
gsn_define_colormap(xwks,"BlAqGrYeOrReVi200")
res@tiMainString = "MYD02HKM.A2010031.0035.005.2010031183706.hdf"
res@gsnLeftString = "Field name: EV_500_RefSB"
res@gsnRightString ="Units: none"
;res@mpLimitMode = "LatLon"
;res@mpMinLatF = min(data@lat2d) ;
;res@mpMaxLatF = max(data@lat2d) ;
;res@mpMinLonF = min(data@lon2d) ;
;res@mpMaxLonF = max(data@lon2d) ;
res@gsnPolar = "NH" ; specify the hemisphere
plot=gsn_csm_contour_map_polar(xwks,data,res)
delete(plot)
delete(xwks)
delete(data)
delete(res)
delete(eos_file)
end
_______________________________________________
ncl-talk mailing list
List instructions, subscriber options, unsubscribe:
http://mailman.ucar.edu/mailman/listinfo/ncl-talk