Date: Mon Sep 06 2010 - 10:17:13 MDT
Hi,
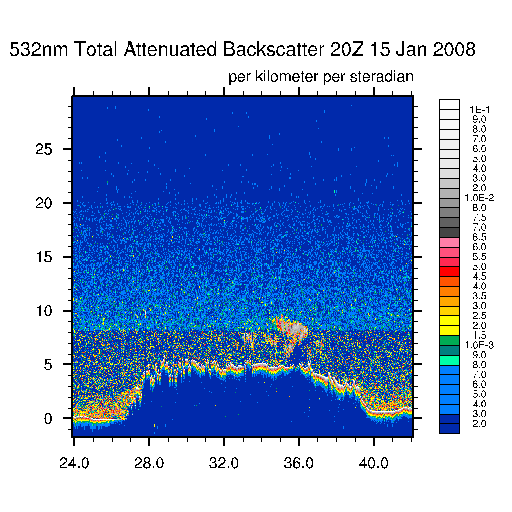
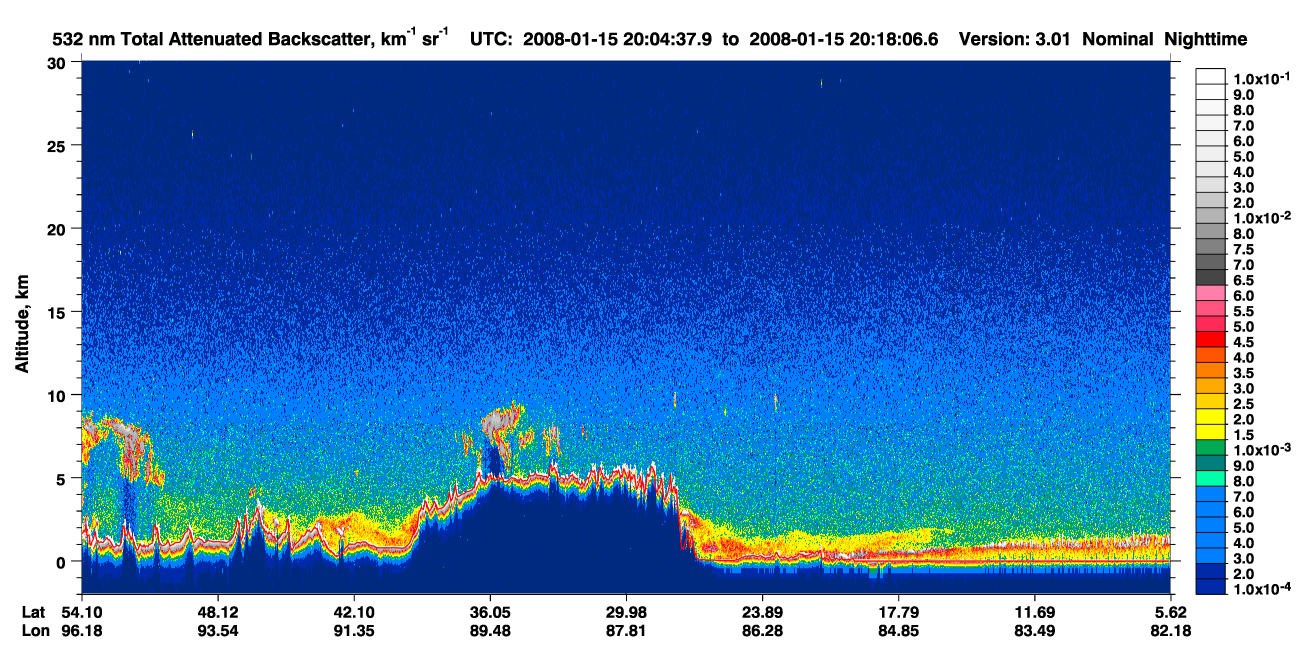
I am using ncl to plot the 532nm Total Attenuated Backscatter data, but on
comparing it with the image available from CALIPSO itself, I find my plot
very noisy (see attached plots).
Besides, the image also appears to have discontinuity at 3 levels, below
8.2km and then upto 20.2 km, and then higher than 20.2 km, which is
coincidentally the regions where CALIPSO data has different vertical
resolutions (30m and 60m and 180 m respectively). The region where vertical
resolution is coarser, the plot appears to be smoother.
I am just using "gsn_csm_contour" to do the contouring with explicit contour
levels.
And I attached the lat and altitude to the variable before plotting.
Looking forward for any suggestion.
Regards,
Prabhakar
_______________________________________________
ncl-talk mailing list
List instructions, subscriber options, unsubscribe:
http://mailman.ucar.edu/mailman/listinfo/ncl-talk