Date: Fri Sep 17 2010 - 22:09:39 MDT
Hello.
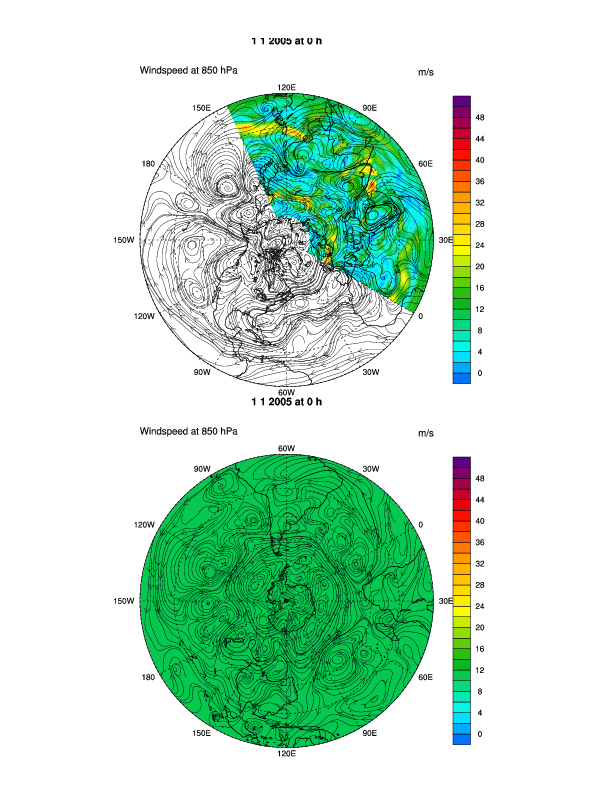
I'm trying to make a panel plot of streamline polar plots with color
contour for wind speed for the both hemispheres.
But when I plotted it, color plot didn't work as I expected (please
see the attached png image).
In the north hemisphere plot, color did work only a portion of the
longitude (0-130 deg).
In the south hemisphere, only one color displayed regardless of the wind speed.
Results are the same when I did not use the panel plot.
I'm using NCEP/NCAR Reanalysis data.
Thank you for your help in advance.
Jinwoong Yoo
LSU
Here goes my NCL code:
;*************************************************
; NCL Graphics: polar_2.ncl
;
; Concepts illustrated:
; - Drawing black-and-white contours over a polar stereographic map
; - Drawing the northern hemisphere of a polar stereographic map
;
;************************************************
load "$NCARG_ROOT/lib/ncarg/nclscripts/csm/gsn_code.ncl"
load "$NCARG_ROOT/lib/ncarg/nclscripts/csm/gsn_csm.ncl"
load "$NCARG_ROOT/lib/ncarg/nclscripts/csm/contributed.ncl"
;************************************************
begin
;************************************************
; read in netCDF file
a = addfile("~/data/uwnd.2005.nc", "r")
b = addfile("~/data/vwnd.2005.nc", "r")
u850=short2flt(a->uwnd(:,2,:,:))
v850=short2flt(b->vwnd(:,2,:,:))
u850!1="lat"
u850!2="lon"
v850!1="lat"
v850!2="lon"
u850&lat@units="degrees_north"
u850&lon@units="degrees_east"
v850&lat@units="degrees_north"
v850&lon@units="degrees_east"
; calculate calendar date using ut_calendar(u&time,0)
; date(i,0)= year
; date(i,1)= month
; date(i,2)= day
; date(i,3)= hour
date = ut_calendar(u850&time,0)
ntime = dimsizes(u850(:,0,0)) ; Get number of timesteps.
;*************************************************
; calculate wind speed
;*************************************************
speed=sqrt(u850^2+v850^2)
;************************************************
; create plot
;************************************************
wks = gsn_open_wks("ps","Polar"); open a ps file
gsn_define_colormap(wks,"BlAqGrYeOrRevi200") ; choose color map
do i= 0,0;ntime-1
res = True ; plot mods desired
res@gsnFrame = False ; Do not draw plot
res@gsnDraw = False ; Do not advance frame
res@cnFillOn = True ; turn on color for contours
res@cnLinesOn = False ; turn off contour lines
res@cnLineLabelsOn = False ; turn off contour line labels
res@cnLevelSelectionMode = "ExplicitLevels" ; Explicitly set
res@cnLevels = ispan(0,50,2)
res@lbLabelAutoStride = True
res@gsnSpreadColors = True ; use full color map
res@gsnSpreadColorStart = 17 ; start at color 17
res@gsnSpreadColorEnd = 200 ; end at color 200
res@tiMainString = date(i,1)+" "+date(i,2)+" 2005 at
"+date(i,3)+" h" ; plot title
res@gsnLeftString = "Windspeed at 850 hPa"
res@gsnRightString = "m/s"
res@mpFillOn = False ; set land to be gray
res@mpGeophysicalLineThicknessF = 1.2
res@mpCenterLonF = -60
res@lbOrientation = "Vertical" ; vertical label bar
res@pmLabelBarOrthogonalPosF = 0.02 ; move label bar closer
res@lbLabelStride = 2
res@stArrowStride = 1 ; arrows start every third
res@stMinArrowSpacingF = 0.075;0.05 ; arrow spacing.
res@stArrowLengthF = 0.01 ; changes the size of the arrows.
res@stLineThicknessF = 0.5 ; changes the line thickness
res@stLineColor = "black" ; changes color
plot=new(2,graphic) ; create graphic array
res@gsnPolar = "NH" ; select the N. Hem.
plot(0) = gsn_csm_streamline_contour_map_polar(wks,u850(i,:,:),v850(i,:,:),speed(i,:,:),res)
delete(res@gsnPolar) ; delete previous option
res@gsnPolarSH = True ; specify the hemisphere
plot(1) =gsn_csm_streamline_contour_map_polar(wks,u850(i,:,:),v850(i,:,:),speed(i,:,:),res)
;***********************************************
; create panel plot
;***********************************************
pres = True ; panel plot mods desired
pres@gsnPanelYWhiteSpacePercent = 1 ; increase white space around
; indiv. plots in panel
pres@gsnMaximize = True ; fill the page
gsn_panel(wks,plot,(/2,1/),pres) ; create panel plot
end do
end
_______________________________________________
ncl-talk mailing list
List instructions, subscriber options, unsubscribe:
http://mailman.ucar.edu/mailman/listinfo/ncl-talk