Date: Thu Sep 16 2010 - 13:51:58 MDT
Mary,
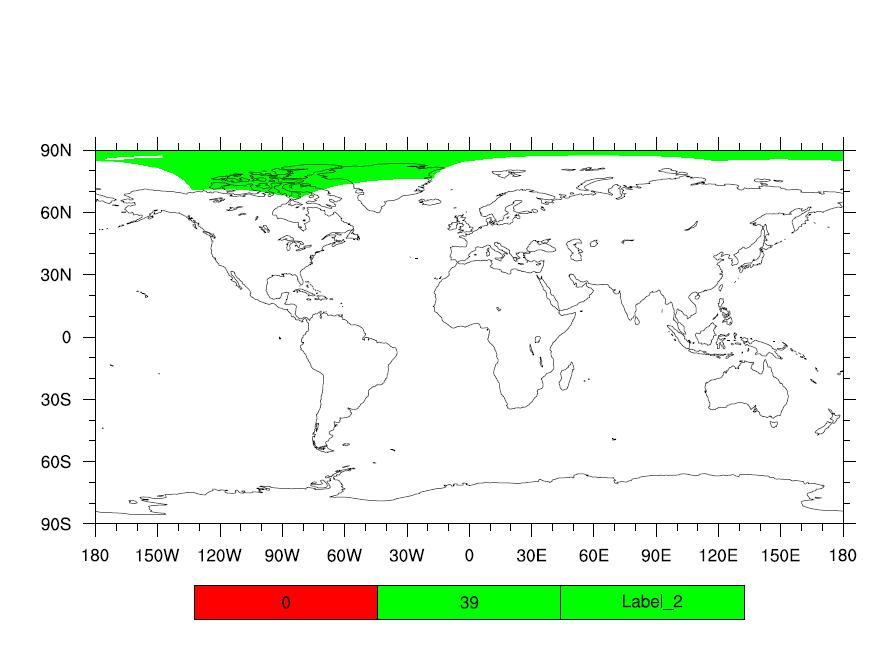
I follow your instruction for below case and got corresponding plot as
attached.
http://www.ncl.ucar.edu/Support/talk_archives/2010/1903.html
I checked the latitude for this file and the location should be right. But
I'm not sure why '0' can not be plotted.
Do you know the reason behind it?
Code:
----------------------------------------------------------------------------
load "$NCARG_ROOT/lib/ncarg/nclex/gsun/gsn_code.ncl"
load "$NCARG_ROOT/lib/ncarg/nclscripts/csm/gsn_csm.ncl"
load "$NCARG_ROOT/lib/ncarg/nclscripts/csm/contributed.ncl"
begin
eos_file=addfile("MOD10_L2.A2000065.0040.005.2008235221207.hdf.he2", "r")
; Read file.
;To read HDF-EOS2 files, .he2 is appended to the argument.
;For more information, consult section 4.3.2 of
http://hdfeos.org/software/ncl.php.
data_byte=eos_file->Snow_Cover_MOD_Swath_Snow
; read data field, getting the clues about
eos_file->Fractional_Snow_Cover_MOD_Swath_Snow
; from print(eos_file)
data=byte2flt(data_byte)
data@_FillValue = 255b
nlon=4060
nlat=2708
lat=asciiread("lat_MOD10_L2.A2000065.0040.005.2008235221207.output",(/nlon,nlat/),"float")
lon=asciiread("lon_MOD10_L2.A2000065.0040.005.2008235221207.output",(/nlon,nlat/),"float")
data@lat2d=lat
data@lon2d=lon
xwks=gsn_open_wks("pdf","MOD10_L2.A2000065.0040.005.2008235221207_Snow_Cover.ncl")
colors=(/"white","black","red","green"/)
gsn_define_colormap(xwks,colors)
setvalues NhlGetWorkspaceObjectId() ; make maximum filesize larger
"wsMaximumSize" : 200000000
end setvalues
res=True
res@cnFillOn=True
res@gsnMaximize=True
res@gsnPaperOrientation = "portrait"
res@cnLinesOn=False
res@cnLineLabelsOn = False
res@gsnSpreadColors=True
res@cnFillMode="RasterFill"
res@cnMissingValFillPattern = 0 ; missing value pattern is set to "SolidFill"
res@cnMissingValFillColor=0; white color for missing values
res@cnLevelSelectionMode="ManualLevels"
res@cnMinLevelValF=0
res@cnMaxLevelValF=39
res@cnLevelSpacingF=39
res@lbLabelStrings = ispan(0,39,39)
res@lbLabelPosition = "Center"
res@lbLabelAlignment = "BoxCenters"
plot=gsn_csm_contour_map_ce(xwks,data,res)
delete(plot) ; cleaning up resources used
delete(data)
delete(res)
delete(eos_file)
end
_______________________________________________
ncl-talk mailing list
List instructions, subscriber options, unsubscribe:
http://mailman.ucar.edu/mailman/listinfo/ncl-talk