Date: Mon Jan 24 2011 - 13:58:04 MST
Dear NCL-ers.
Apologies if you receive this twice.
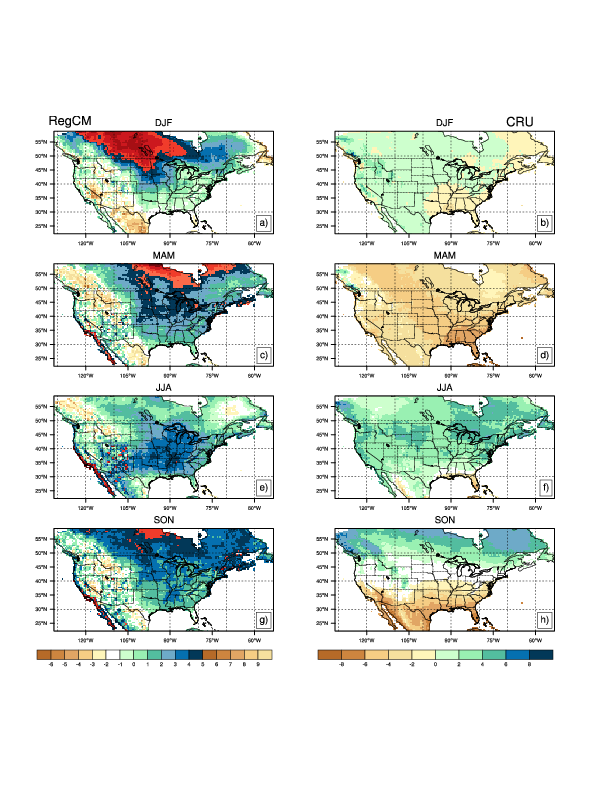
I am trying to make a complex panel plot displaying 2 variables (temp. and precip. biases) using different color tables. My script mimics code in http://ncl.ucar.edu/Applications/Scripts/panel_12.ncl and is *Ualmost* right. The LHS column (temp.) and RHS column (precip.) both look fine and use their different color tables, and have seperate labelbars beneath each column. However, the issue I cannot solve is that the colors of the colorbar only come from the color table for precip -- the RHS column which was drawn last.
How can I insert the correct label bar for the temperature column? I really don't want to have precip and temperature differences use the same color table. Nor do I want to split into two seperate plots.
The misbehaving plot is attached, and relevant code snippet is below.
Many thanks,
Maurice
;--------------------------------------------------------------------------------------------------------
; Create panel. plotT and plotP are the graphical arrays containing the individual
; Temp and Precip plots for paneling.
;--------------------------------------------------------------------------------------------------------
resP = True ; modify the panel plot
resP@gsnPanelLabelBar = True ; add common colorbar
resP@lbLabelFontHeightF = 0.007 ; make labels smaller
resP@gsnFrame = False ; don't advance panel plot
resP@gsnPanelYWhiteSpacePercent = 2.5
resP@gsnPanelXWhiteSpacePercent = 2.5
resP@gsnPanelFigureStrings= (/ "a)","c)","e)","g)" /) ; add strings to panel
resP@txFontHeightF = .24
resP@gsnMaximize = True
resP@gsnPanelRight = 0.5 ; draw from left edge to center
gsn_panel(wks,plotT,(/4,1/),resP) ; now draw as one plot
;--------------------------------------------------------------------------------------------------------
;--------------------------------------------------------------------------------------------------------
resP2 = True
resP2@gsnPanelLabelBar = True ; add common colorbar
resP2@lbLabelFontHeightF = 0.007 ; make labels smaller
resP2@gsnFrame = False ; don't advance panel plot
resP2@gsnPanelYWhiteSpacePercent = 2.5
resP2@gsnPanelXWhiteSpacePercent = 2.5
resP2@txFontHeightF = .24
resP2@gsnMaximize = True
resP2@gsnPanelFigureStrings= (/ "b)","d)","f)","h)" /) ; add strings to panel
resP2@gsnPanelLeft = 0.5 ; draw from center to right edge
gsn_panel(wks,plotP,(/4,1/),resP2) ; now draw as one plot
;--------------------------------------------------------------------------------------------------------
; Add column labels to panel.
;--------------------------------------------------------------------------------------------------------
txres = True
txres@txFontHeightF = 0.0165
gsn_text_ndc(wks,"RegCM",0.1,0.99,txres)
gsn_text_ndc(wks,"CRU",0.9,0.99,txres)
frame(wks)
_______________________________________________
ncl-talk mailing list
List instructions, subscriber options, unsubscribe:
http://mailman.ucar.edu/mailman/listinfo/ncl-talk