Date: Fri Mar 04 2011 - 07:50:48 MST
Dear all,
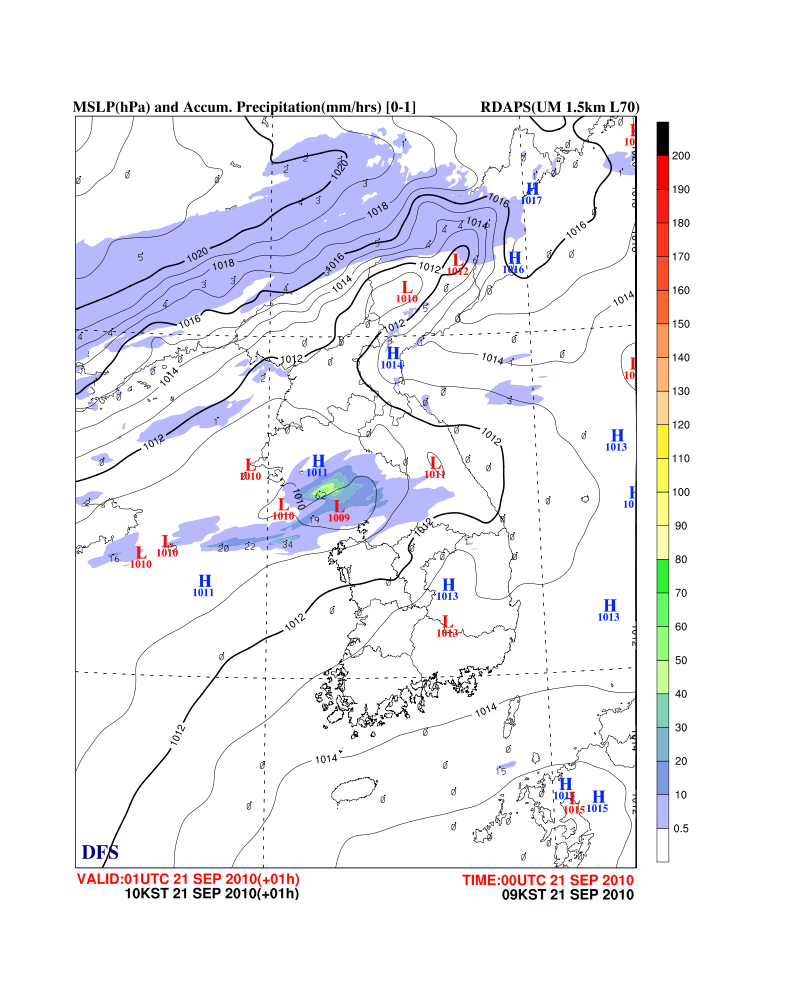
I had draw polyline using gsn_polyline function for line countour plot and
then overlay this plot to another filled contour plot .
But strangely only contour line can see over this filled contour and
polyline are below filled contours.
As you can see in the attached picture, only line contour can see over
filled and polyline ( coast line and political boundaries are
under the filled contour so can't see. )
Could anyone let me know how I can make this polyline can see over the
filled contours ?
The followings are major part of my ncl codes. Please check and let me know
where should I fix.
=========================================================================
begin
.....
res = True
res@mpProjection ="LambertConformal"
res@mpLambertParallel1F = 30.0 ; two parallels
res@mpLambertParallel2F = 60.0
res@mpLambertMeridianF = 126.0
--- define map area using Corners mode --
res@gsnDraw = False
res@gsnFrame = False
; First line contour plot
res@cnInfoLabelOn = False
res@cnLineLabelPlacementMode = "Constant"
res@cnInfoLabelOrthogonalPosF = 0.07
res@cnLineLabelInterval = 1
res@cnMonoLineThickness = False
res@cnFillOn = False
res@cnLineLabelInterval = 2
res@tfDoNDCOverlay = True
plot2 = gsn_csm_contour_map(wks,P,res)
; read polygon data then draw polyline for coast line and political
boundaries
fname = "/root/high_korea_map.dat"
nrow = numAsciiRow(fname)
data = asciiread(fname, (/nrow, 2/), "float")
nm = 0
; draw coast line and political boundaries for plot2
res_poly = True
res_poly@gsEdgesOn = True ; draw border around polygons
res_poly@gsEdgeColor = "black"
res_poly@gsFillColor = -1
res_poly@gsLineColor = "Black" ; color of lines
res_poly@gsLineThicknessF = 1.0
do while ( nm .lt. nrow )
np = floattointeger( data(nm,0) )
x = new(np,"float")
y = new(np,"float")
nstart = nm+1
x(0) = data(nstart,0)
y(0) = data(nstart,1)
do i= nstart+1, np+nm
x(i -nstart) = data(i, 0)
y(i-nstart) = data(i,1)
end do
gsn_polyline(wks,plot2,x,y,res_poly)
nm = nm+np+1
delete(x)
delete(y)
end do
; second filled contour for precipitation
res1 = True
res1@mpLimitMode = "Corners" ; limit map via lat/lon
res1@mpLeftCornerLatF = 32.1631622 ; map area
res1@mpRightCornerLatF = 43.0738945 ; latitudes
res1@mpLeftCornerLonF = 121.802254 ; and
res1@mpRightCornerLonF = 132.368515 ; longitudes
res1@gsnDraw = False ; don't draw the plots now
res1@gsnFrame = False ; or advance the frame
res1@cnFillDrawOrder ="PreDraw"
res1@cnFillOn = True
res1@tfDoNDCOverlay = True
plot3 = gsn_csm_contour_map(wks,Rain,res1)
draw(plot3)
draw(plot2)
frame(wks)
end
===================================================================================
Best regards,
John Hyun
_______________________________________________
ncl-talk mailing list
List instructions, subscriber options, unsubscribe:
http://mailman.ucar.edu/mailman/listinfo/ncl-talk