Dear NCL users,
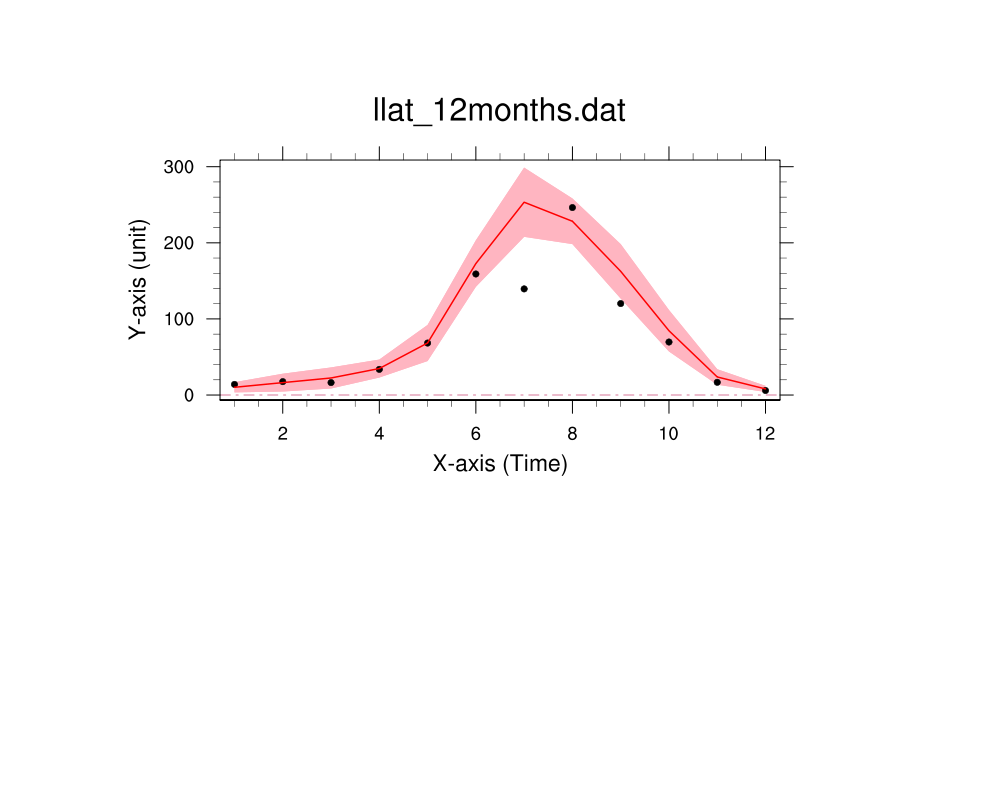
The attached files are ncl script, input data and a plot. The plot is what I
wanted but with a trick to make it using "gsn_csm_xy".
(1) why here did the "bot_plot = gsn_csm_xy (wks,tim,dots,res)" always ask
2-dimension data (dots), so I have to duplicate the same data one more time?
(2) How to make "res@lbLabelStride= 1" work?
(3) How to overlay "dots" on the top?
Thanks a lot!
Mark
_______________________________________________
ncl-talk mailing list
List instructions, subscriber options, unsubscribe:
http://mailman.ucar.edu/mailman/listinfo/ncl-talk
This archive was generated by hypermail 2.1.8 : Thu Mar 10 2011 - 21:44:37 MST