NCL users,
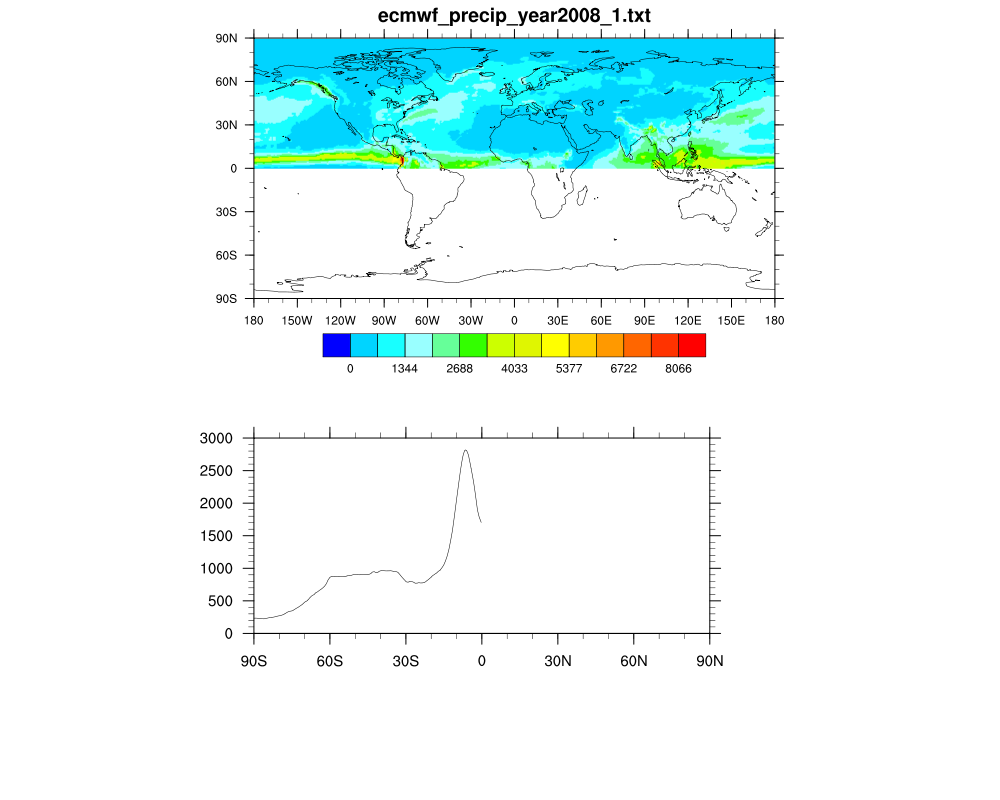
I have a global data file as "data(lat,lon)" and would make a zonal average as
below. I especially set southern hemisphere as missing data for distinguishing
between northern and southern hemisphere (see the attached plot).
plot=new(2,graphic)
data!0 = "lat"
data!1 = "lon"
data&lat = lat(::-1)
data&lon = lon
data@_FillValue = msg_val
clat=conform(data,lat,0)
data=where(clat.lt.0,data,-9999.0)
bbb=dim_avg_Wrap(data)
plot(0) = gsn_csm_contour_map(wks,data,res)
plot(1) = gsn_csm_xy (wks, lat,bbb,zres)
(1) Why is the latitude not consistent for both spatial pattern (data) and zonal
average (bbb)?
(2) How to make the second plot starting from 90N to 90S instead of from 90S to
90N?
(3) I could make the correct plot by "plot(1) = gsn_csm_xy (wks,
lat(::-1),bbb,zres)" but why didn't the "dim_avg_Wrap(data)" pass the consistent
latitude?
(4) By the way, can one explain a bit more about sfXArray and sfYArray? (extra
question, not related here :-) )
Thanks a lot,
Mark
_______________________________________________
ncl-talk mailing list
List instructions, subscriber options, unsubscribe:
http://mailman.ucar.edu/mailman/listinfo/ncl-talk
This archive was generated by hypermail 2.1.8 : Tue Apr 19 2011 - 18:32:03 MDT