Date: Wed May 04 2011 - 21:35:36 MDT
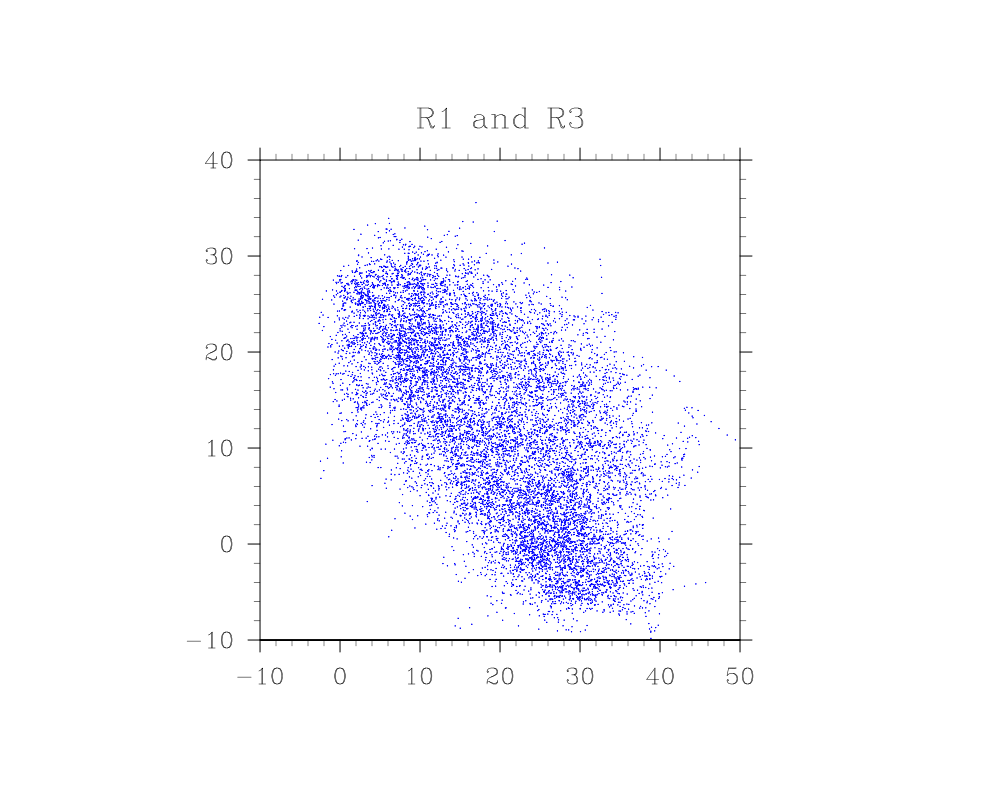
I downloaded the file that you used from NOAA and made some changes to the
code to illustrate how to put the regression line into the plot as well as a
few other things. I notice that your plot shows a negative correlation
between the two hemispheric values, whereas mine shows the opposite. I guess
that doesn't matter, as long as you see how to add the regression line. You
can also add the regression line with an overlay, but this way is simpler.
Chad
On Wed, May 4, 2011 at 10:19 PM, <ncl-talk-request@ucar.edu> wrote:
> Send ncl-talk mailing list submissions to
> ncl-talk@ucar.edu
>
> To subscribe or unsubscribe via the World Wide Web, visit
> http://mailman.ucar.edu/mailman/listinfo/ncl-talk
> or, via email, send a message with subject or body 'help' to
> ncl-talk-request@ucar.edu
>
> You can reach the person managing the list at
> ncl-talk-owner@ucar.edu
>
> When replying, please edit your Subject line so it is more specific
> than "Re: Contents of ncl-talk digest..."
>
>
> Today's Topics:
>
> 1. scatter plot: displaying the best fit line (gs416492@albany.edu)
>
>
> ----------------------------------------------------------------------
>
> Message: 1
> Date: Wed, 4 May 2011 22:18:04 -0400 (EDT)
> From: gs416492@albany.edu
> Subject: scatter plot: displaying the best fit line
> To: ncl-talk@ucar.edu
> Message-ID:
> <55059.76.78.32.211.1304561884.squirrel@webmail.albany.edu>
> Content-Type: text/plain; charset="iso-8859-1"
>
> Hello,
>
> I have been working on a script based off of this code:
>
> http://www.ncl.ucar.edu/Applications/Scripts/scatter_4.ncl
>
> I am trying to make a scatter plot of monthly mean u-winds in two
> different regions, using the ncep/ncar reanalysis and the gsn_csm_xy
> function. Whenever I run the script, I get a scatter plot but no best fit
> line. Does anyone know what I'm doing wrong here?
>
> The script I am running is below. I also attached a copy of what the
> scatter plot looks like when I run the script.
>
> -Gabriel Susca-Lopata
> Undergraduate student at SUNY Albany
>
> ----------------------------------------------------------------------
>
> begin
>
> load "$NCARG_ROOT/lib/ncarg/nclscripts/csm/gsn_code.ncl"
> load "$NCARG_ROOT/lib/ncarg/nclscripts/csm/gsn_csm.ncl"
> load "$NCARG_ROOT/lib/ncarg/nclscripts/csm/contributed.ncl"
>
> ;loop to create an array of the time values to read from
> ;the uwnd.mon.mean.nc file. Is supposed to pick
> ;pick DJF over the range of years
> a1=new((/189/), integer)
> do n = 0,751,12
> a2 = (/n+5,n+6,n+7/)
> a1(n/4:n/4+2) = a2
> end do
> ;print(a1)
>
> f = addfile("uwnd.mon.mean.nc", "r")
>
>
> uwind_nhem1 = f->uwnd(a1,8,21:25,26:38) ; DJF,250mb,27.5-37.5N,65-95E
> uwind_shem1 = f->uwnd(a1,8,42:46,12:24) ; "","",15-25S,30-60E
>
> ;unpack the values
>
> uwind_nhem1d = 202.65 + (ndtooned(uwind_nhem1)*.01)
> uwind_shem1d = 202.65 + (ndtooned(uwind_shem1)*.01)
>
> ;calculate the correlation
> corr = escorc(uwind_nhem1d, uwind_shem1d)
> print(corr)
>
> wks = gsn_open_wks("png","regressR1R3")
>
> res = True ; plot mods desired
> res@xyMarkLineModes = (/"Markers","Lines"/)
> res@xyMarkers = 16 ; choose type of marker
> res@xyMarkerColor = "blue" ; Marker color
> res@xyMarkerSizeF = 0.001 ; Marker size (default
> 0.01)
> res@xyDashPatterns = 1 ; solid line
> res@xyLineThicknesses = (/1,2/) ; set second line to 2
> ;res@xyCurveDrawOrder = "PostDraw"
> ;res@xyMonoLineColor = True
> ;res@xyLineColor = "red"
>
> res@tiMainString = "R1 and R3" ; title
>
> plot = gsn_csm_xy (wks,uwind_shem1d,uwind_nhem1d,res) ; create plot
>
> end
> -------------- next part --------------
> A non-text attachment was scrubbed...
> Name: regressR1R3.000001.png
> Type: image/png
> Size: 139495 bytes
> Desc: not available
> Url :
> http://mailman.ucar.edu/pipermail/ncl-talk/attachments/20110504/40ba147c/attachment.png
>
> ------------------------------
>
> _______________________________________________
> ncl-talk mailing list
> ncl-talk@ucar.edu
> http://mailman.ucar.edu/mailman/listinfo/ncl-talk
>
>
> End of ncl-talk Digest, Vol 90, Issue 5
> ***************************************
>
_______________________________________________
ncl-talk mailing list
List instructions, subscriber options, unsubscribe:
http://mailman.ucar.edu/mailman/listinfo/ncl-talk
- text/x-ncl attachment: example.ncl
