Erica Rivera,
Why do you set
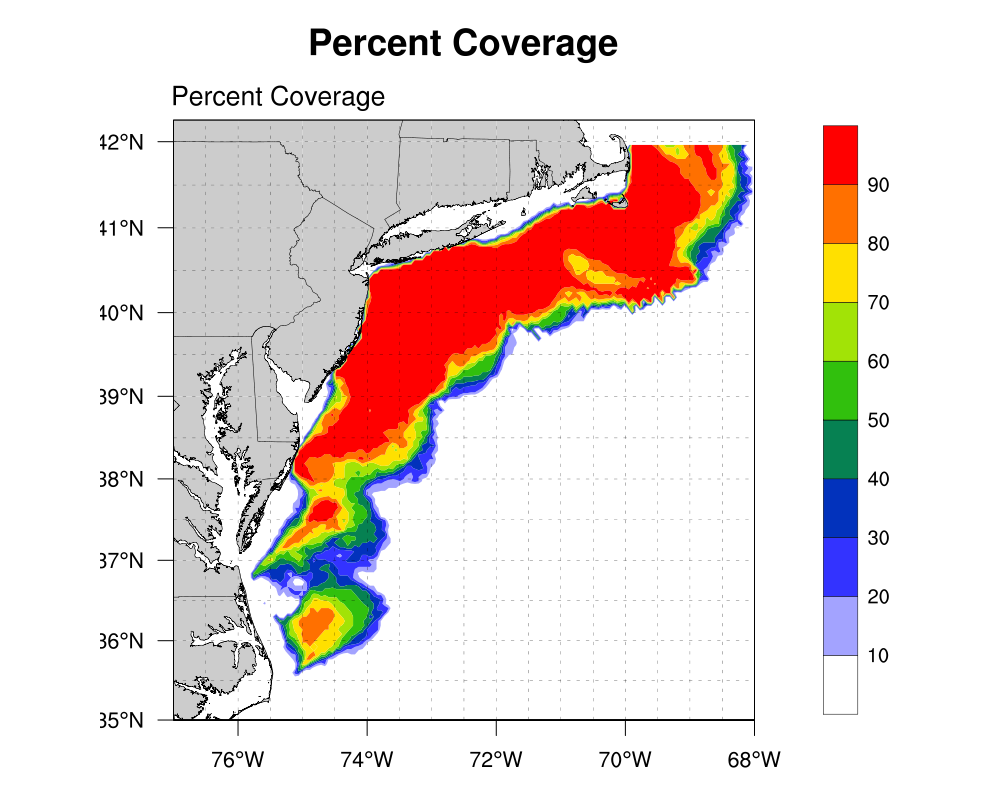
res@cnMinLevelValF = 0. ?
Do you want Min to be 10?
Yongzuo
________________________________________
From: ncl-talk-bounces@ucar.edu [ncl-talk-bounces@ucar.edu] on behalf of ncl-talk-request@ucar.edu [ncl-talk-request@ucar.edu]
Sent: Friday, May 13, 2011 2:42 PM
To: ncl-talk@ucar.edu
Subject: ncl-talk Digest, Vol 90, Issue 21
Send ncl-talk mailing list submissions to
ncl-talk@ucar.edu
To subscribe or unsubscribe via the World Wide Web, visit
http://mailman.ucar.edu/mailman/listinfo/ncl-talk
or, via email, send a message with subject or body 'help' to
ncl-talk-request@ucar.edu
You can reach the person managing the list at
ncl-talk-owner@ucar.edu
When replying, please edit your Subject line so it is more specific
than "Re: Contents of ncl-talk digest..."
Today's Topics:
1. png output name (George McCabe)
2. Re: png output name (Adam Phillips)
3. Color Bar (Erick Rivera Lemus)
----------------------------------------------------------------------
Message: 1
Date: Fri, 13 May 2011 12:50:44 -0600
From: George McCabe <mccabe@ucar.edu>
Subject: png output name
To: ncl-talk@ucar.edu
Message-ID: <4DCD7D84.5030504@ucar.edu>
Content-Type: text/plain; charset=ISO-8859-1
I have an NCL script that generates png images. When setting NCARG_ROOT
to ncarg-5.1.0, the image names look like 'maxsev.png.' When I set
NCARG_ROOT to ncarg-5.2.1, the image name is 'maxsev.000001.png.' Is
there a way to configure the new version to not add the numbered
extension? Please let me know if you need more information.
Thanks,
George
------------------------------
Message: 2
Date: Fri, 13 May 2011 12:57:32 -0600
From: Adam Phillips <asphilli@ucar.edu>
Subject: Re: png output name
To: ncl-talk@ucar.edu
Message-ID: <4DCD7F1C.9050002@ucar.edu>
Content-Type: text/plain; charset=ISO-8859-1; format=flowed
Hi George,
This issue was dealt with in NCL 6.0.0-beta and the forthcoming 6.0.0:
http://www.ncl.ucar.edu/current_release.shtml#PNGFileNames6.0.0-beta
I am unaware of an easy method to alter the underlying 5.2.1 code to
output png in the format that 6.0.0-beta does it. A developer would have
to chime in on that. I would venture to say though that your best bet
would be to either download 6.0.0-beta or to wait a couple weeks and
download 6.0.0 when it's released... Adam
On 05/13/2011 12:50 PM, George McCabe wrote:
> I have an NCL script that generates png images. When setting NCARG_ROOT
> to ncarg-5.1.0, the image names look like 'maxsev.png.' When I set
> NCARG_ROOT to ncarg-5.2.1, the image name is 'maxsev.000001.png.' Is
> there a way to configure the new version to not add the numbered
> extension? Please let me know if you need more information.
>
> Thanks,
>
> George
> _______________________________________________
> ncl-talk mailing list
> List instructions, subscriber options, unsubscribe:
> http://mailman.ucar.edu/mailman/listinfo/ncl-talk
--
__________________________________________________
Adam Phillips
asphilli@ucar.edu
National Center for Atmospheric Research   tel: (303) 497-1726
Climate and Global Dynamics Division         fax: (303) 497-1333
P.O. Box 3000
Boulder, CO 80307-3000    http://www.cgd.ucar.edu/cas/asphilli
------------------------------
Message: 3
Date: Fri, 13 May 2011 15:42:25 -0400
From: Erick Rivera Lemus <lemus@marine.rutgers.edu>
Subject: Color Bar
To: ncl-talk@ucar.edu
Message-ID: <353ADC3F-B6FB-415F-9505-D00E022D8E51@marine.rutgers.edu>
Content-Type: text/plain; charset="us-ascii"
Dear NCL users,
I am having difficulties trying to arrange the color bar on the
following plot. I want the plot to look like the test.Auto_levels.png
figure (see attachment),  however I want to adjust the bar to start
from 0 to 100. When I set the cnLevelSlectionMode to Manual level and
select the contour spacing I get the test.Manual_levels.png (see
attachment) figure and for some reason the colors change. This is what
I have as my settings (see attach). I think I am missing something,
but I can not figure out what seems to be the problem if it is on the
label bar or with the colors. Not sure. Let me know if you have any
suggestions. Thanks.
res                             = True             ; plot mods desired
; Contour lines settings
  res@cnFillOn                    = True             ; turn on color
  res@cnLinesOn                   = False            ; no contour lines
  res@cnLevelSelectionMode        = "ManualLevels"   ; set manual
contour levels
  res@cnMinLevelValF              = 0.               ; set min contour
level
  res@cnMaxLevelValF              = 100.               ; set max
contour level
  res@cnLevelSpacingF             = 10.               ; contour spacing
  res@gsnSpreadColors             = True             ; use full color
map
  res@gsnSpreadColorStart         = 0
  res@gsnSpreadColorEnd           = -2               ; don't use added
gray
  res@lbOrientation               ="vertical"        ; vertical label
bar
  res@lbLabelAutoStride           = True                    ; every
other label
; Map settings
  ;This will start Zooming into the MAB and creating a Mercator
Projection
res@mpProjection                = "mercator"       ; projection
  res@mpLimitMode                 = "Corners"        ; method to zoom
  res@mpLeftCornerLatF            = minLat;min(lat)
  res@mpLeftCornerLonF            = minLon;min(lon)
  res@mpRightCornerLatF           = maxLat;max(lat)
  res@mpRightCornerLonF           = maxLon;max(lon)
  res@cnFillDrawOrder       = "PreDraw"    ; fill first
  res@gsnAddCyclic = False;
  res@mpLandFillColor = "gray"; Map fill color is gray
  res@mpOutlineOn = True; Draw map outline
  res@mpDataBaseVersion = "HighRes"; Medium resolution map
  res@mpDataBaseVersion           = "HighRes"       ; use MAB High
Resolution
  res@pmTickMarkDisplayMode       = "Always"         ; turn on tickmarks
  res@mpFillDrawOrder            = "Draw"
; Turn on map grid
res@mpGridAndLimbOn = True;
; Set gridline intervals
res@mpGridSpacingF = 0.5; ; 1/2 degree intervals
res@mpGridLineDashPattern = 2; ; dashed line
res@mpGridLineThicknessF = 0.5;
Cheers,
Erick Rafael Rivera Lemus
Software Technician
Institute of Marine and Coastal Sciences
Coastal Ocean Observation Laboratory
Rutgers, The State University of New Jersey
71 Dudley Road New Brunswick, NJ 08901 Phone: 732-932-6555 ext. 503
Fax: 732-932-1821
Cell: 617-447-5106
-------------- next part --------------
A non-text attachment was scrubbed...
Name: test.Manual_levels.png
Type: image/png
Size: 209477 bytes
Desc: not available
Url : http://mailman.ucar.edu/pipermail/ncl-talk/attachments/20110513/d0f833de/attachment.png
-------------- next part --------------
A non-text attachment was scrubbed...
Name: test.Auto_levels.png
Type: image/png
Size: 200768 bytes
Desc: not available
Url : http://mailman.ucar.edu/pipermail/ncl-talk/attachments/20110513/d0f833de/attachment-0001.png
-------------- next part --------------
------------------------------
_______________________________________________
ncl-talk mailing list
ncl-talk@ucar.edu
http://mailman.ucar.edu/mailman/listinfo/ncl-talk
End of ncl-talk Digest, Vol 90, Issue 21
****************************************
_______________________________________________
ncl-talk mailing list
List instructions, subscriber options, unsubscribe:
http://mailman.ucar.edu/mailman/listinfo/ncl-talk
Received on Fri May 13 16:42:10 2011
This archive was generated by hypermail 2.1.8 : Tue May 17 2011 - 15:11:28 MDT