Date: Thu Jul 14 2011 - 09:25:05 MDT
Hi,
I have some difficulty in plotting NASA MISR data [1] with NCL.
The NCL version is 6.0.0.
First, let me explain the important characteristics of NASA MISR data.
It has 180 blocks of 512 x 128 grid data.
Thus, the original data is stored in 3-D array of 180 x 512 x 128.
The corresponding geo-location data is stored in a separate file in [2].
My goal is to plot all or some blocks of grid data using 3 "do...
end do" loops.
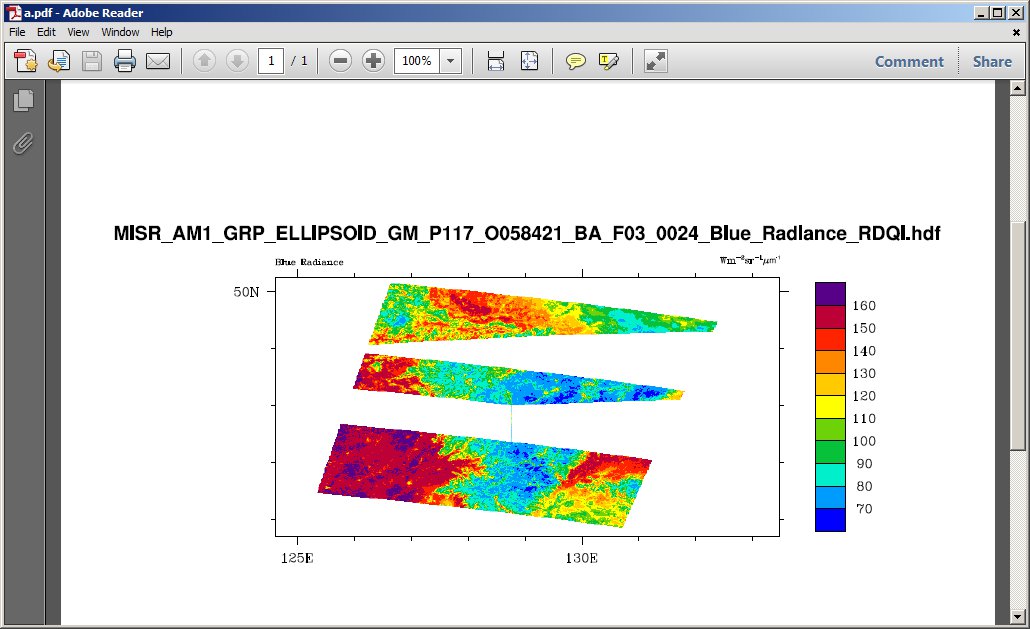
In the attached NCL code, I'm plotting 3 blocks --- block 50 to block52.
The problem is as follows.
NCL works fine with plotting 1 block, say 50.
However, if I increase the number of blocks to 2, 3, ..., n,
it skips plotting some part of data in each block.
Can anyone explain what could be wrong either in my code or NCL?
Please see the attached NCL code and output images.
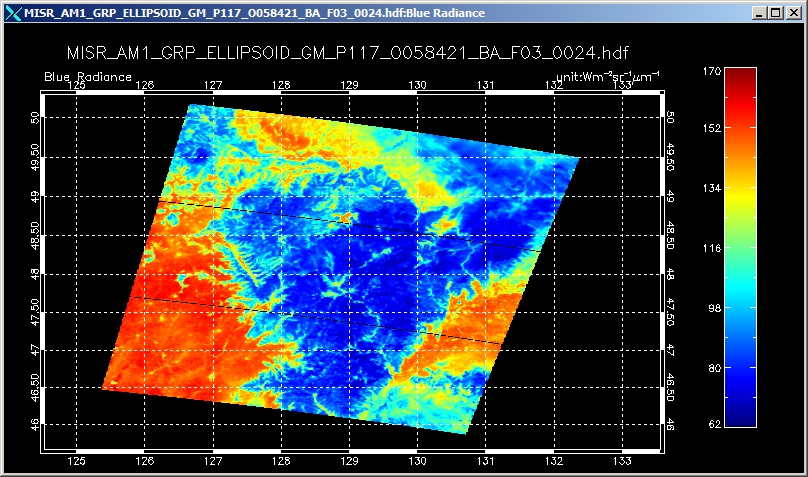
I also added the expected image produced by IDL.
IDL uses the same 3 loops to subset/reform data and works fine.
Thanks,
[1] ftp://ftp.hdfgroup.uiuc.edu/pub/outgoing/NASAHDF/MISR_AM1_GRP_ELLIPSOID_GM_P117_O058421_BA_F03_0024.hdf
[2] ftp://ftp.hdfgroup.uiuc.edu/pub/outgoing/NASAHDF/MISR_AM1_AGP_P117_F01_24.hdf
--
1.217.531.6125 @ 61820-7059
Docs into PDF, Data into HDF.
_______________________________________________
ncl-talk mailing list
List instructions, subscriber options, unsubscribe:
http://mailman.ucar.edu/mailman/listinfo/ncl-talk