Date: Wed Aug 17 2011 - 07:07:21 MDT
attachment..
On Wed, Aug 17, 2011 at 9:06 AM, Advait Godbole <advaitgodbole@gmail.com>wrote:
> Dear List Members,
>
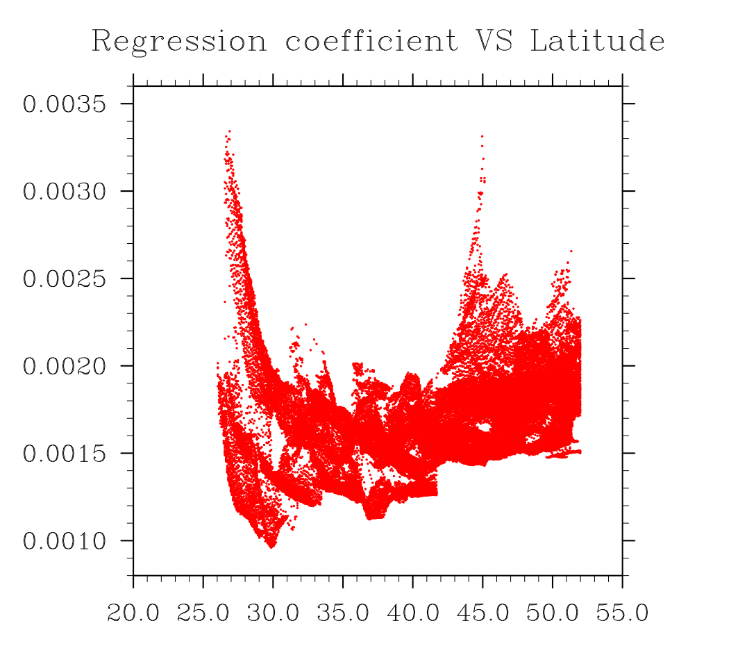
> I have a 2D variable "rc" containing regression coefficients. I have tried
> plotting it as a function of latitude but intuitively it somehow does not
> seem right. I am expecting increasing values as latitude increases and that
> does seem apparent in the plot but it looks like a power spectra. My code
> could be right but I have sense that I am not following the correct syntax.
> Please find the code reproduced below and the plot attached - apologies if
> that is not the accepted method of sharing attachments, I am new to the
> list.
>
> The plotting code:
>
> ;************************************************
> ; plotting parameters, scatter plot of regression coefficient VS latitude
> ; ************************************************
> wks = gsn_open_wks ("png","Regression.coefficient.VS.latitude")
> ; open workstation
>
> res = True ; plot mods desired
> res@tiMainString = "Regression coefficient VS Latitude" ;
> add title
> res@xyMonoMarkLineMode= True
> res@xyMarkLineMode = "Markers" ; choose which have
> markers
> res@xyMonoMarker = True
> res@xyMarker = 16 ; choose type of marker
> res@xyMarkerColor = "red" ; Marker color
> res@xyMarkerSizeF = 0.002 ; Marker size (default
> 0.01)
>
> res@tmLabelAutoStride = True ; nice tick mark labels
>
> * plot = gsn_csm_xy (wks,rc&lat,rc,res) ; create plot*
>
> Many thanks,
>
> --
> advait godbole
>
--
advait godbole
_______________________________________________
ncl-talk mailing list
List instructions, subscriber options, unsubscribe:
http://mailman.ucar.edu/mailman/listinfo/ncl-talk