Date: Mon Aug 29 2011 - 11:04:36 MDT
Hi!
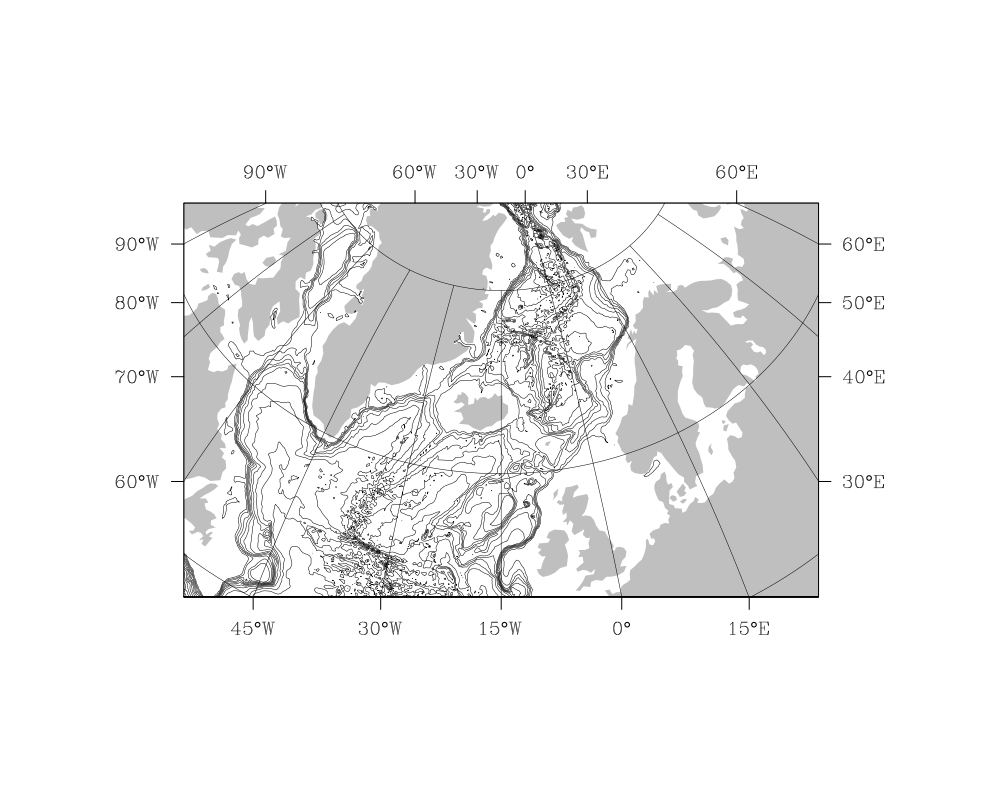
I'm trying to get lon & lat labels on a map plot, using
pmTickMarkDisplayMode = "Always"
(full code below, image attached), partly successfully.
My problem is that longitudes are labeled along all four sides of the plot, while there are no latitude labels. I think that the longitude ranges are larger than latitude ranges along all sides, perhaps that's the source of my problem?
Is there a way for me to shift from longitude to latitude labels along the y-axes?
Best regard,
Arne Melsom
System info:
ncl v. 5.2.1, Linux pc2850 2.6.32-28-generic-pae #55-Ubuntu SMP
Code:
load "$NCARG_ROOT/lib/ncarg/nclscripts/csm/gsn_code.ncl"
load "$NCARG_ROOT/lib/ncarg/nclscripts/csm/gsn_csm.ncl"
begin
topoFile = addfile("topo.nc","r")
depth = topoFile->depth(327:,135:)
lon = topoFile->lon(327:,135:)
lat = topoFile->lat(327:,135:)
depth@lon2d = lon
depth@lat2d = lat
wks = gsn_open_wks("png", "topo" )
res = True
res@mpLimitMode = "LatLon"
res@mpMinLatF = 50
res@mpMaxLatF = 80
res@mpMinLonF = -60
res@mpMaxLonF = 30.
res@mpProjection = "Satellite"
res@mpCenterLonF = -15
res@mpCenterLatF = 60
res@mpGridAndLimbOn = True
res@pmTickMarkDisplayMode = "Always"
res@lbLabelBarOn = False
res@gsnMaximize = True
res@cnInfoLabelOn = False
res@cnLineLabelsOn = False
depth@long_name = ""
depth@units = ""
plot = gsn_csm_contour_map(wks,depth,res)
end
_______________________________________________
ncl-talk mailing list
List instructions, subscriber options, unsubscribe:
http://mailman.ucar.edu/mailman/listinfo/ncl-talk