Hi,
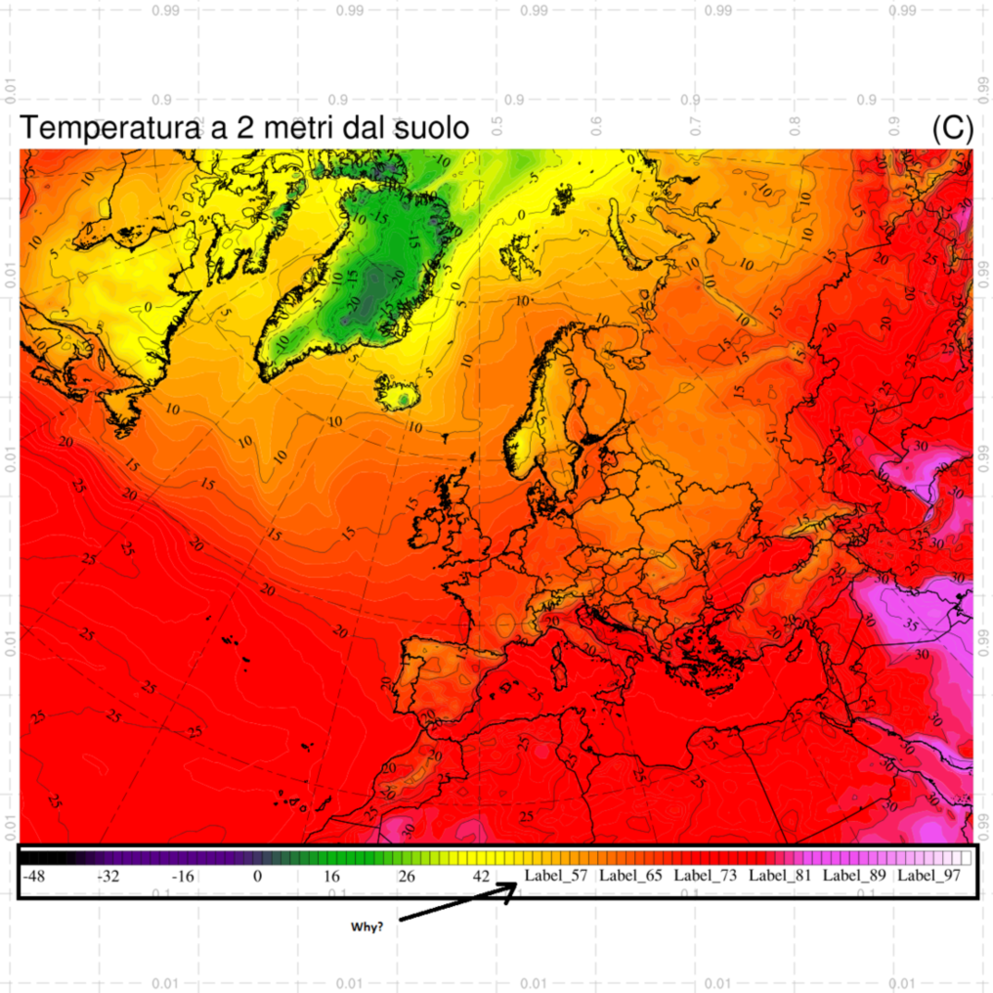
I'm trying to customize the laber bar and would like to put label fonts every two step here my code
;----------------------------------------------------------------------
; This example shows how to read geographic data
; from Natural Earth shapefiles
; and plot them as polylines and polygons.
;----------------------------------------------------------------------
; This particular example plots data for Switzerland.
;----------------------------------------------------------------------
; Download the shapefiles from http://www.naturalearthdata.com/
; Unzip to a directory
;----------------------------------------------------------------------
load "$NCARG_ROOT/lib/ncarg/nclscripts/csm/gsn_code.ncl"
load "$NCARG_ROOT/lib/ncarg/nclscripts/csm/gsn_csm.ncl"
load "$NCARG_ROOT/lib/ncarg/nclscripts/csm/contributed.ncl"
load "$NCARG_ROOT/lib/ncarg/nclscripts/csm/shea_util.ncl"
begin
;*****************************************
; Open workstation and define colormap *
;*****************************************
wks_type = "png" ; use "newpdf" instead of "pdf" for smaller files
wks_type@wkWidth = 1200
wks_type@wkHeight = 1200
wks = gsn_open_wks(wks_type,"temp")
gsn_define_colormap(wks,"tbr_var_0-500") ; choose colormap
;*****************
; Generare map *
;*****************
;--- resouces for map
res = True ; plot mods desired
res@mpProjection = "LambertConformal" ; choose projection
res = True ; plot mods desired
res@gsnMaximize = True
res@gsnDraw = False ; do not draw the plot
res@gsnFrame = False ; do not flip the page
res@mpProjection = "LambertConformal" ; choose projection
res@mpLimitMode = "LatLon"
res@mpMaxLonF = 47.0
res@mpMaxLatF = 88.5
res@mpMinLatF = 27.0
res@mpMinLonF = -43.0
res@mpGridAndLimbOn = True ; turn on grid lines
res@mpGridLineDashPattern = 10 ; lat/lon lines dashed
drawNDCGrid(wks)
map = gsn_csm_map(wks,res)
;--- create map from shapefiles
fnames = "/mnt/internetserver/map/shapefile/europa/aaa_full/" + (/"europa"/) + ".shp" ; Files to be open
linecolors = (/"Black"/) ; color definition for each shapefile
fillcolors = (/"Transparent"/) ; Fill color definition for each shapefile
thicks = (/2/) ; Thickness for each shapefile
lnres = True ; resources for polylines
plres = True
prims = True
lines = True
do n=0,dimsizes(fnames)-1 ; Loop through files that we want to read geographic information from.
f = addfile(fnames(n),"r") ; Open the shapefile number n.
segments = f->segments ; Read data off the shapefile
geometry = f->geometry
segsDims = dimsizes(segments)
geomDims = dimsizes(geometry)
geom_segIndex = f@geom_segIndex ; Read global attributes
geom_numSegs = f@geom_numSegs
segs_xyzIndex = f@segs_xyzIndex
segs_numPnts = f@segs_numPnts
geometry_type = f@geometry_type
numFeatures = geomDims(0)
lon = f->x
lat = f->y
if (geometry_type.eq."polygon") then ; Put if statement outside the loop
plres@gsFillColor = fillcolors(n)
plres@gsEdgesOn = True ; Draw border around polygons
plres@gsEdgeColor = linecolors(n)
plres@gsEdgeThicknessF = thicks(n)
do i=0, numFeatures-1 ; Section to draw polygons on map.
startSegment = geometry(i, geom_segIndex)
numSegments = geometry(i, geom_numSegs)
do seg=startSegment, startSegment+numSegments-1
startPT = segments(seg, segs_xyzIndex)
endPT = startPT + segments(seg, segs_numPnts) - 1
dumstr = unique_string("lines") ; This call adds the polygon.
map@$dumstr$ = gsn_add_polygon(wks, map , lon(startPT:endPT), lat(startPT:endPT), plres)
end do
end do
else
lnres@gsLineThicknessF = thicks(n)
lnres@gsLineColor = linecolors(n)
do i=0, numFeatures-1 ; Section to draw polylines on map.
startSegment = geometry(i, geom_segIndex)
numSegments = geometry(i, geom_numSegs)
do seg=startSegment, startSegment+numSegments-1
startPT = segments(seg, segs_xyzIndex)
endPT = startPT + segments(seg, segs_numPnts) - 1
dumstr = unique_string("primitive") ; This call adds the line segment.
map@$dumstr$ = gsn_add_polyline(wks, map, lon(startPT:endPT), lat(startPT:endPT), lnres)
end do
end do
end if
delete(lat) ; Clean up before we read in same variables again.
delete(lon)
delete(segments)
delete(geometry)
delete(segsDims)
delete(geomDims)
end do
;******************
; read gfs data *
;******************
url = "http://nomad1.ncep.noaa.gov:9090/dods/gfs_master/gfs" + systemfunc("date +%Y%m%d") + "/"
systemdate = systemfunc("date +%H")
if ((systemdate.ge.06).and.(systemdate.lt.12)) then
filename = url + "gfs_master_00z"
end if
if ((systemdate.ge.12).and.(systemdate.lt.18)) then
filename = url + "gfs_master_06z"
end if
if ((systemdate.ge.18).and.(systemdate.lt.23)) then
filename = url + "gfs_master_06z"
end if
if ((systemdate.ge.23).and.(systemdate.lt.06)) then
filename = url + "gfs_master_18z"
end if
exists = isfilepresent(filename)
if(.not.exists) then
print("OPeNDAP isfilepresent test unsuccessful.")
print("Either file doesn't exist, or NCL does not have OPeNDAP capabilities on this system")
else
print("OPeNDAP isfilepresent test successful.")
gfs = addfile(filename,"r")
vars = getfilevarnames(gfs)
end if
;*******************************
; 2 metres temperature plot *
;*******************************
;--- resouces for 2 metres temperature plot
res1= True
res1@gsnMaximize = True
res1@gsnDraw = False ; do not draw the plot
res1@gsnFrame = False ; do not flip the page
res1@gsnAddCyclic = True
res1@gsnSpreadColors = True ; use entire color map
res1@gsnContourNegLineDashPattern = 1
res1@gsnSpreadColorEnd = -2
res1@cnFillOn = True ; turn on color
res1@cnLineDashSegLenF = 0.04
res1@cnLinesOn = True ; turn on contour lines
res1@cnLineLabelsOn = True ; turn on contour labels
res1@cnLineLabelFont = "times-roman" ; set font on contour labels
res1@cnLineLabelFontHeightF = 0.006 ; set font height on contour labels
res1@cnLineLabelPlacementMode = "Constant" ; set placement mode of labels on contour
res1@cnLineLabelBackgroundColor = "Transparent" ; set background color of the contour label
res1@cnLevelSelectionMode = "ManualLevels" ; set how manage contour line levels
res1@cnMinLevelValF = -50 ; max level do draw contour lines
res1@cnMaxLevelValF = 50 ; min level do draw contour lines
res1@cnLevelSpacingF = 1 ; set spacing between contour lines
res1@cnLevelFlags = (/"LineAndLabel","NoLine","NoLine","NoLine","NoLine","LineAndLabel","NoLine","NoLine","NoLine","NoLine", \
"LineAndLabel","NoLine","NoLine","NoLine","NoLine","LineAndLabel","NoLine","NoLine","NoLine","NoLine", \
"LineAndLabel","NoLine","NoLine","NoLine","NoLine","LineAndLabel","NoLine","NoLine","NoLine","NoLine", \
"LineAndLabel","NoLine","NoLine","NoLine","NoLine","LineAndLabel","NoLine","NoLine","NoLine","NoLine", \
"LineAndLabel","NoLine","NoLine","NoLine","NoLine","LineAndLabel","NoLine","NoLine","NoLine","NoLine", \
"LineAndLabel","NoLine","NoLine","NoLine","NoLine","LineAndLabel","NoLine","NoLine","NoLine","NoLine", \
"LineAndLabel","NoLine","NoLine","NoLine","NoLine","LineAndLabel","NoLine","NoLine","NoLine","NoLine", \
"LineAndLabel","NoLine","NoLine","NoLine","NoLine","LineAndLabel","NoLine","NoLine","NoLine","NoLine", \
"LineAndLabel","NoLine","NoLine","NoLine","NoLine","LineAndLabel","NoLine","NoLine","NoLine","NoLine", \
"LineAndLabel","NoLine","NoLine","NoLine","NoLine","LineAndLabel","NoLine","NoLine","NoLine","NoLine", \
"LineAndLabel"/) ; set how draw contour lines
res1@lbLabelsOn = True ; turn on the labels
res1@lbLabelAutoStride = True ; let NCL determine label spacing
res1@lbLeftMarginF = 0.001
res1@lbOrientation = "horizontal" ; label orientation
res1@lbBoxLinesOn = True ; turn on lines between labelbar colors
res1@lbLabelFont= "times-roman" ; font
res1@lbLabelFontHeightF= 0.007 ; set the label size
res1@lbLabelAlignment = "BoxCenters"
res1@pmLabelBarHeightF = 0.04
res1@cnExplicitLabelBarLabelsOn = True
res1@lbLabelStrings =(/"-50","-48","-46","-44","-42","-40","-38","-36","-34","-32","-30","-28","-26","-24","-22","-20","-18","-16","-14","-12","-10","-8","-6","-4","-2", \
"0","2","4","6","8","10","12","14","16","18","20","22","24","26","28","30","32","34","36","38","40","42","44","46","48","50"/)
;---data for 2 metres temperature plot
TEMP2M = gfs->tmp2m(:,:,:) ; temperature
NTIMES = dimsizes(gfs->time) ; number of times in the file
TEMP2M = TEMP2M - 273.15
TEMP2M@units = "(C)"
TEMP2M@long_name = "Temperatura a 2 metri dal suolo"
do it = 0,0
plot = gsn_csm_contour(wks,TEMP2M(it,:,:),res1)
overlay(map,plot)
draw(map)
frame(wks)
end do
do it = 0,0
if (it.le.8) then
system("mv temp.00000" + (it+1) + ".png" + " temperatura0" + (it) + "_" + systemfunc("date +%Y%m%d%H") + ".png")
end if
if (it.eq.9) then
system("mv temp.0000" + (it+1) + ".png" + " temperatura0" + (it) + "_" + systemfunc("date +%Y%m%d%H") + ".png")
end if
if (it.ge.10) then
system("mv temp.0000" + (it+1) + ".png" + " temperatura" + (it) + "_" + systemfunc("date +%Y%m%d%H") + ".png")
end if
end do
end
end here the result
http://i103.photobucket.com/albums/m136/ugo73/temp-3.png
also which in the starting point of the contour map so I can align it with the laber bar?
Regards
Ugo
_______________________________________________
ncl-talk mailing list
List instructions, subscriber options, unsubscribe:
http://mailman.ucar.edu/mailman/listinfo/ncl-talk
Received on Sat Sep 10 12:01:26 2011
This archive was generated by hypermail 2.1.8 : Mon Sep 12 2011 - 13:37:01 MDT