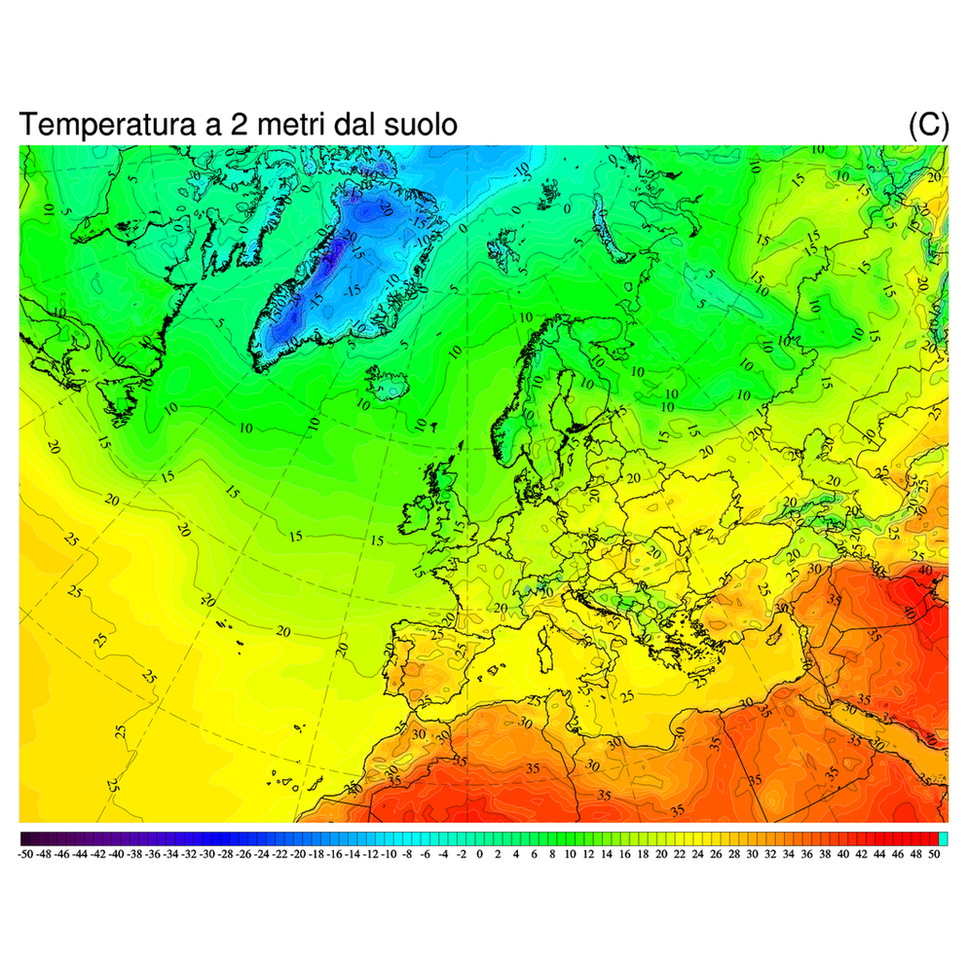
You have 101 levels (-50 -- +50 w/ step size 1) and cnFillColors is set with 101 colors. If you read the documentation for cnFillColors you will see that it needs to have one more color than there are levels. That is so values both below the minimum level and above the maximum level can be assigned a color. I think you simply need to add one more color index value to cnFillColors.
-dave
On Sep 21, 2011, at 4:23 PM, ugo merlini wrote:
> Hi
>
> I still have label bar problem as can be seen on picture below at the end of the label bar there is a light blue box which in teory is not part of the labal bar
>
> How delete it?
>
> ugo
>
>
> http://i103.photobucket.com/albums/m136/ugo73/temperatura02_2011092123.png
>
>
>
>
>
>
>
> ;----------------------------------------------------------------------
> ; This example shows how to read geographic data
> ; from Natural Earth shapefiles
> ; and plot them as polylines and polygons.
> ;----------------------------------------------------------------------
> ; This particular example plots data for Switzerland.
> ;----------------------------------------------------------------------
> ; Download the shapefiles from http://www.naturalearthdata.com/
> ; Unzip to a directory
> ;----------------------------------------------------------------------
>
> load "$NCARG_ROOT/lib/ncarg/nclscripts/csm/gsn_code.ncl"
> load "$NCARG_ROOT/lib/ncarg/nclscripts/csm/gsn_csm.ncl"
> load "$NCARG_ROOT/lib/ncarg/nclscripts/csm/contributed.ncl"
> load "$NCARG_ROOT/lib/ncarg/nclscripts/csm/shea_util.ncl"
>
> begin
>
> ;*****************************************
> ; Open workstation and define colormap *
> ;*****************************************
>
> wks_type = "png" ; use "newpdf" instead of "pdf" for smaller files
> wks_type@wkWidth = 1600
> wks_type@wkHeight = 1600
> wks = gsn_open_wks(wks_type,"temp")
> gsn_define_colormap(wks,"rainbow+white+gray") ; choose colormap
>
> ;*****************
> ; Generare map *
> ;*****************
> ;--- resouces for map
> res = True ; plot mods desired
> res@mpProjection = "LambertConformal" ; choose projection
>
> res = True ; plot mods desired
>
> res@gsnMaximize = True
> res@gsnDraw = False ; do not draw the plot
> res@gsnFrame = False ; do not flip the page
>
> res@mpProjection = "LambertConformal" ; choose projection
> res@mpLimitMode = "LatLon"
> res@mpMaxLonF = 47.0
> res@mpMaxLatF = 88.5
> res@mpMinLatF = 27.0
> res@mpMinLonF = -43.0
> res@mpGridAndLimbOn = True ; turn on grid lines
> res@mpGridLineDashPattern = 10 ; lat/lon lines dashed
>
>
> drawNDCGrid(wks)
>
> map = gsn_csm_map(wks,res)
>
> ;--- create map from shapefiles
>
> fnames = "/mnt/internetserver/map/shapefile/europa/aaa_full/" + (/"europa"/) + ".shp" ; Files to be open
> linecolors = (/"Black"/) ; color definition for each shapefile
> fillcolors = (/"Transparent"/) ; Fill color definition for each shapefile
> thicks = (/2/) ; Thickness for each shapefile
> lnres = True ; resources for polylines
> plres = True
> prims = True
> lines = True
> do n=0,dimsizes(fnames)-1 ; Loop through files that we want to read geographic information from.
> f = addfile(fnames(n),"r") ; Open the shapefile number n.
> segments = f->segments ; Read data off the shapefile
> geometry = f->geometry
> segsDims = dimsizes(segments)
> geomDims = dimsizes(geometry)
> geom_segIndex = f@geom_segIndex ; Read global attributes
> geom_numSegs = f@geom_numSegs
> segs_xyzIndex = f@segs_xyzIndex
> segs_numPnts = f@segs_numPnts
> geometry_type = f@geometry_type
> numFeatures = geomDims(0)
> lon = f->x
> lat = f->y
> if (geometry_type.eq."polygon") then ; Put if statement outside the loop
> plres@gsFillColor = fillcolors(n)
> plres@gsEdgesOn = True ; Draw border around polygons
> plres@gsEdgeColor = linecolors(n)
> plres@gsEdgeThicknessF = thicks(n)
> do i=0, numFeatures-1 ; Section to draw polygons on map.
> startSegment = geometry(i, geom_segIndex)
> numSegments = geometry(i, geom_numSegs)
> do seg=startSegment, startSegment+numSegments-1
> startPT = segments(seg, segs_xyzIndex)
> endPT = startPT + segments(seg, segs_numPnts) - 1
> dumstr = unique_string("lines") ; This call adds the polygon.
> map@$dumstr$ = gsn_add_polygon(wks, map , lon(startPT:endPT), lat(startPT:endPT), plres)
> end do
> end do
> else
> lnres@gsLineThicknessF = thicks(n)
> lnres@gsLineColor = linecolors(n)
> do i=0, numFeatures-1 ; Section to draw polylines on map.
> startSegment = geometry(i, geom_segIndex)
> numSegments = geometry(i, geom_numSegs)
> do seg=startSegment, startSegment+numSegments-1
> startPT = segments(seg, segs_xyzIndex)
> endPT = startPT + segments(seg, segs_numPnts) - 1
> dumstr = unique_string("primitive") ; This call adds the line segment.
> map@$dumstr$ = gsn_add_polyline(wks, map, lon(startPT:endPT), lat(startPT:endPT), lnres)
> end do
> end do
> end if
> delete(lat) ; Clean up before we read in same variables again.
> delete(lon)
> delete(segments)
> delete(geometry)
> delete(segsDims)
> delete(geomDims)
> end do
>
> ;******************
> ; read gfs data *
> ;******************
>
> url = "http://nomad1.ncep.noaa.gov:9090/dods/gfs_master/gfs" + systemfunc("date +%Y%m%d") + "/"
> systemdate = systemfunc("date +%H")
>
> if ((systemdate.ge.06).and.(systemdate.lt.12)) then
> filename = url + "gfs_master_00z"
> end if
> if ((systemdate.ge.12).and.(systemdate.lt.18)) then
> filename = url + "gfs_master_06z"
> end if
> if ((systemdate.ge.18).and.(systemdate.lt.24)) then
> filename = url + "gfs_master_06z"
> end if
> if ((systemdate.ge.06).and.(systemdate.lt.06)) then
> filename = url + "gfs_master_18z"
> end if
> filename = "http://nomad1.ncep.noaa.gov:9090/dods/gfs_master/gfs20110916/gfs_master_18z"
> exists = isfilepresent(filename)
> if(.not.exists) then
> print("OPeNDAP isfilepresent test unsuccessful.")
> print("Either file doesn't exist, or NCL does not have OPeNDAP capabilities on this system")
> else
> print("OPeNDAP isfilepresent test successful.")
> gfs = addfile(filename,"r")
> vars = getfilevarnames(gfs)
> end if
>
> ;*******************************
> ; 2 metres temperature plot *
> ;*******************************
> ;--- resouces for 2 metres temperature plot
> res1= True
>
> res1@gsnMaximize = True
> res1@gsnDraw = False ; do not draw the plot
> res1@gsnFrame = False ; do not flip the page
> res1@gsnAddCyclic = True
> res1@gsnSpreadColors = False ; turn off the use entire color map
> res1@gsnContourNegLineDashPattern = 10
>
>
>
>
>
>
> res1@cnLineDashSegLenF = 0.04
>
> res1@cnLinesOn = True ; turn on contour lines
> res1@cnLineLabelsOn = True ; turn on contour labels
> res1@cnLineLabelFont = "times-roman" ; set font on contour labels
> res1@cnLineLabelFontHeightF = 0.006 ; set font height on contour labels
> res1@cnLineLabelPlacementMode = "Constant" ; set placement mode of labels on contour
> res1@cnLineLabelBackgroundColor = "Transparent" ; set background color of the contour label
>
> res1@cnLevelSelectionMode = "ManualLevels" ; set how manage contour line levels
> res1@cnMinLevelValF = -50 ; max level do draw contour lines
> res1@cnMaxLevelValF = 50 ; min level do draw contour lines
> res1@cnLevelSpacingF = 1 ; set spacing between contour lines
> res1@cnLevelFlags = (/"LineAndLabel","LineOnly","LineOnly","LineOnly","LineOnly","LineAndLabel","LineOnly","LineOnly","LineOnly","LineOnly", \
> "LineAndLabel","LineOnly","LineOnly","LineOnly","LineOnly","LineAndLabel","LineOnly","LineOnly","LineOnly","LineOnly", \
> "LineAndLabel","LineOnly","LineOnly","LineOnly","LineOnly","LineAndLabel","LineOnly","LineOnly","LineOnly","LineOnly", \
> "LineAndLabel","LineOnly","LineOnly","LineOnly","LineOnly","LineAndLabel","LineOnly","LineOnly","LineOnly","LineOnly", \
> "LineAndLabel","LineOnly","LineOnly","LineOnly","LineOnly","LineAndLabel","LineOnly","LineOnly","LineOnly","LineOnly", \
> "LineAndLabel","LineOnly","LineOnly","LineOnly","LineOnly","LineAndLabel","LineOnly","LineOnly","LineOnly","LineOnly", \
> "LineAndLabel","LineOnly","LineOnly","LineOnly","LineOnly","LineAndLabel","LineOnly","LineOnly","LineOnly","LineOnly", \
> "LineAndLabel","LineOnly","LineOnly","LineOnly","LineOnly","LineAndLabel","LineOnly","LineOnly","LineOnly","LineOnly", \
> "LineAndLabel","LineOnly","LineOnly","LineOnly","LineOnly","LineAndLabel","LineOnly","LineOnly","LineOnly","LineOnly", \
> "LineAndLabel","LineOnly","LineOnly","LineOnly","LineOnly","LineAndLabel","LineOnly","LineOnly","LineOnly","LineOnly", \
> "LineAndLabel"/) ; set how draw contour lines
> res1@cnFillColors = (/12,14,16,18,20,22,24,26,28,30,32,34,36,38,40,42,44,46,48,50,52,54,56,58,60,62,64,66,68,70,72,74,76,78,80,82,84,86,88,90,92,94,96,98,100,102,104,106,108,110,112,114,116,118,120,122,124,128,132,136,140,144,148,152,156,160,164,166,168,170,172,174,176,178,180,182,184,186,188,190,192,194,196,198,200,202,204,206,208,210,212,214,216,218,220,222,224,226,228,230,232/)
> res1@cnMonoLineColor = False ; turn off auto contour line colors
> res1@cnLineColors = (/"Black","White","White","White","White","Black","White","White","White","White", \
> "Black","White","White","White","White","Black","White","White","White","White", \
> "Black","White","White","White","White","Black","White","White","White","White", \
> "Black","White","White","White","White","Black","White","White","White","White", \
> "Black","White","White","White","White","Black","White","White","White","White", \
> "Black","White","White","White","White","Black","White","White","White","White", \
> "Black","White","White","White","White","Black","White","White","White","White", \
> "Black","White","White","White","White","Black","White","White","White","White", \
> "Black","White","White","White","White","Black","White","White","White","White", \
> "Black","White","White","white","White","Black","White","White","White","White", \
> "Black"/) ; set contour lines colors
> res1@cnMonoLineThickness = False ; turn off auto contour line thickness
> res1@cnLineThicknesses = (/1.0,0.5,0.5,0.5,0.5,1.0,0.5,0.5,0.5,0.5, \
> 1.0,0.5,0.5,0.5,0.5,1.0,0.5,0.5,0.5,0.5, \
> 1.0,0.5,0.5,0.5,0.5,1.0,0.5,0.5,0.5,0.5, \
> 1.0,0.5,0.5,0.5,0.5,1.0,0.5,0.5,0.5,0.5, \
> 1.0,0.5,0.5,0.5,0.5,1.0,0.5,0.5,0.5,0.5, \
> 1.0,0.5,0.5,0.5,0.5,1.0,0.5,0.5,0.5,0.5, \
> 1.0,0.5,0.5,0.5,0.5,1.0,0.5,0.5,0.5,0.5, \
> 1.0,0.5,0.5,0.5,0.5,1.0,0.5,0.5,0.5,0.5, \
> 1.0,0.5,0.5,0.5,0.5,1.0,0.5,0.5,0.5,0.5, \
> 1.0,0.5,0.5,0.5,0.5,1.0,0.5,0.5,0.5,0.5, \
> 1.0/) ; set contour lines thickness
>
> res1@lbLabelsOn = True ; turn on the labels
> ;res1@lbLabelAutoStride = False ; let NCL determine label spacing
> res1@lbLeftMarginF = 0.001
> res1@lbOrientation = "horizontal" ; label orientation
> res1@lbBoxLinesOn = True ; turn on lines between labelbar colors
> res1@lbLabelFont= "times-roman" ; font
> res1@lbLabelFontHeightF= 0.005 ; set the label size
> res1@lbLabelAlignment = "BoxCenters"
> res1@pmLabelBarHeightF = 0.04
> res1@lbLabelStride = 2 ; label every other box
>
>
> res1@cnFillOn = True ; turn on color
>
>
>
>
>
>
> ;---data for 2 metres temperature plot
>
> TEMP2M = gfs->tmp2m(:,:,:) ; temperature
> NTIMES = dimsizes(gfs->time) ; number of times in the file
> TEMP2M = TEMP2M - 273.15
> TEMP2M@units = "(C)"
> TEMP2M@long_name = "Temperatura a 2 metri dal suolo"
> do it = 0,1 ;NTIMES-1
> plot = gsn_csm_contour(wks,TEMP2M(it,:,:),res1)
> overlay(map,plot)
> draw(map)
> frame(wks)
> end do
> do it = 0,1 ;NTIMES-1
> if (it.le.8) then
> system("mv temp.00000" + (it+1) + ".png" + " temperatura0" + (it) + "_" + systemfunc("date +%Y%m%d%H") + ".png")
> end if
> if (it.eq.9) then
> system("mv temp.0000" + (it+1) + ".png" + " temperatura0" + (it) + "_" + systemfunc("date +%Y%m%d%H") + ".png")
> end if
> if (it.ge.10) then
> system("mv temp.0000" + (it+1) + ".png" + " temperatura" + (it) + "_" + systemfunc("date +%Y%m%d%H") + ".png")
> end if
> end do
> end
>
>
> _______________________________________________
> ncl-talk mailing list
> List instructions, subscriber options, unsubscribe:
> http://mailman.ucar.edu/mailman/listinfo/ncl-talk
_______________________________________________
ncl-talk mailing list
List instructions, subscriber options, unsubscribe:
http://mailman.ucar.edu/mailman/listinfo/ncl-talk
Received on Wed Sep 21 20:45:33 2011
This archive was generated by hypermail 2.1.8 : Thu Sep 22 2011 - 17:12:44 MDT