Date: Wed Nov 23 2011 - 12:43:27 MST
Hi Guilherme,
I can set these values as _FillValue.
Best regards,
Mateus
2011/11/23 Guilherme Martins <jgmsantos@gmail.com>
> Hi users,
>
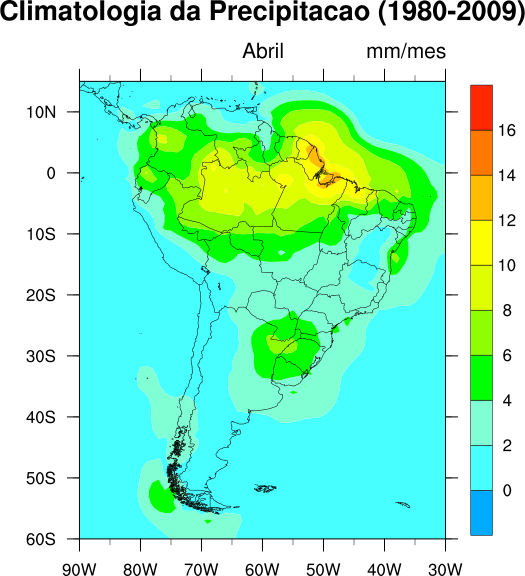
> How I do to plot only values above 1 (mm/mes). My variable is
> precipitation. My script is attach.
>
> [image: PRR_ABR.png]
>
> Thanks,
>
> Guilherme.
>
> --
> Guilherme Martins
> Homepage: http://guilhermemartins.hd1.com.br/
>
>
>
>
> _______________________________________________
> ncl-talk mailing list
> List instructions, subscriber options, unsubscribe:
> http://mailman.ucar.edu/mailman/listinfo/ncl-talk
>
>
--
Mateus da Silva Teixeira
https://linuxcounter.net/cert/466740.png
_______________________________________________
ncl-talk mailing list
List instructions, subscriber options, unsubscribe:
http://mailman.ucar.edu/mailman/listinfo/ncl-talk