Date: Wed Nov 30 2011 - 13:36:00 MST
Hi,
I am trying to plot a vector for a particular domain. But when I am
plotting the vector for my domain the values getting shifted. For example
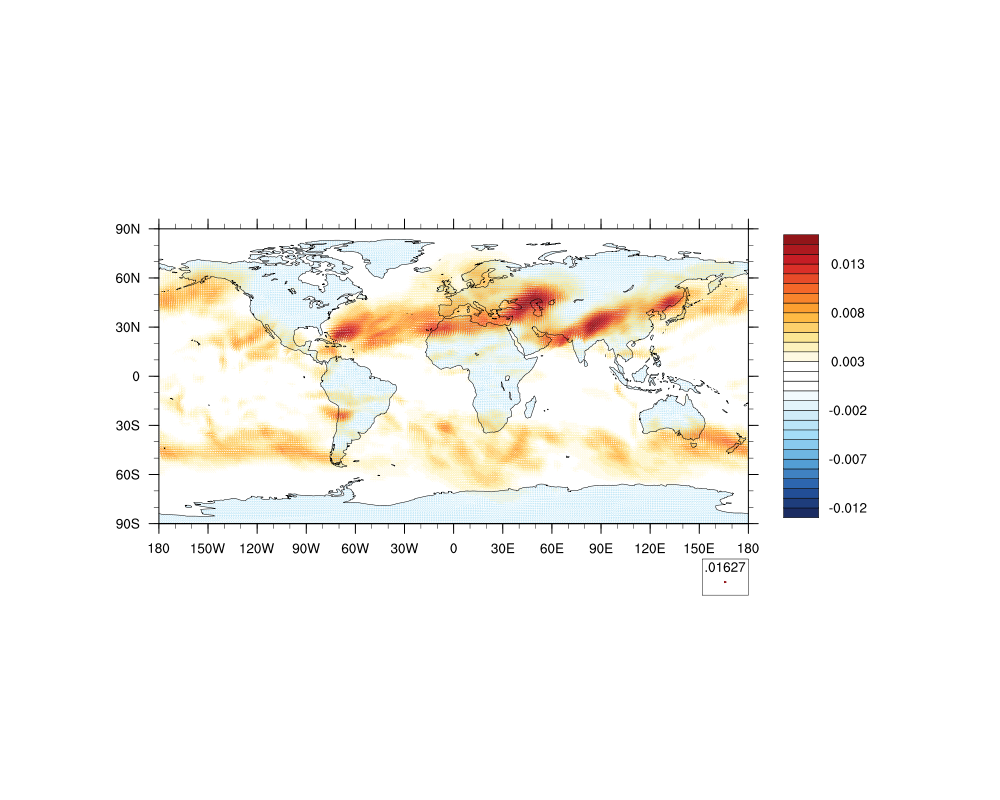
I plotted seasonal moisture Flux for DJF on the whole world and I can see
the storm tracks with higher values and looks correct. But when I am
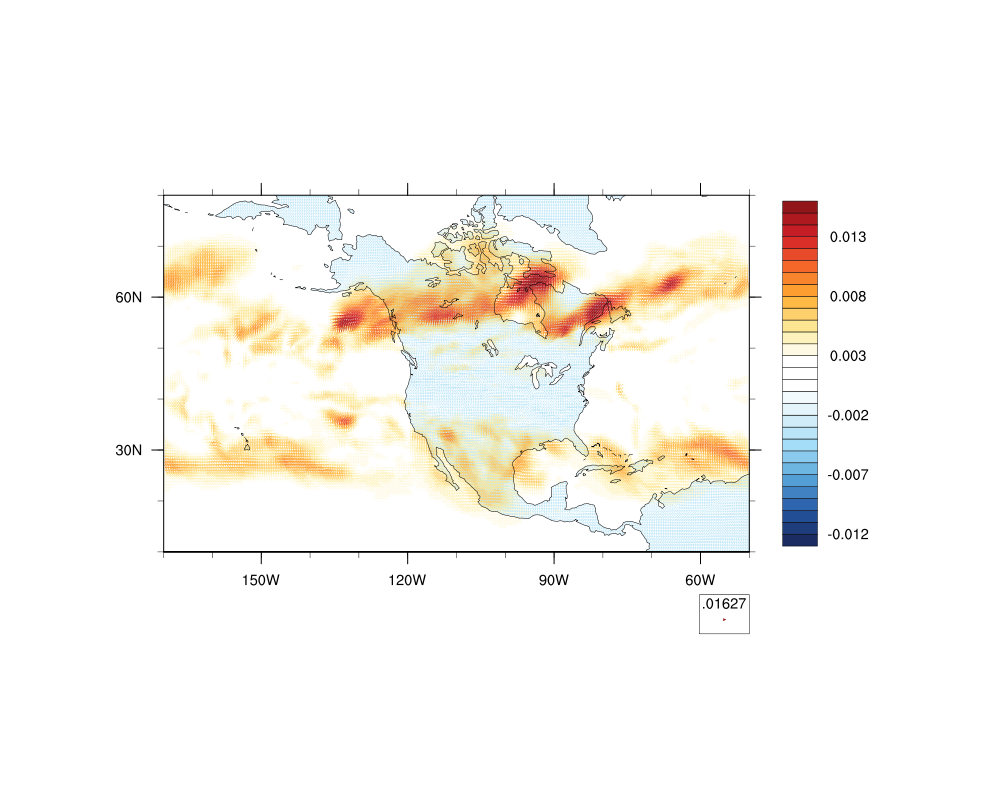
plotting for a small domain like North America the values are shifted. I
am attaching the vector plot for the whole world and North America if you
compare those two you can see the values have shifted and looks like the
map projection changed too. So I plotted the domain only based on my
criteria and it did correctly but if I put vector on that it's getting
changed. My dataset is CAM 3.1 output.
I have also tried overlaying the vector plot on the top of the map of my
domain.But it didn't worked.
Can anybody please give me some suggestion regarding this problem?
Thanks,
--
"Numbing the pain for a while will make it worse when you finally feel it.
 ~J.K. Rowling"
*****************************************
Soumik Basu
Graduate Student, Research Assistant
International Arctic Research Center
University of Alaska Fairbanks
Fairbanks,Alaska,USA
*****************************************
-----------------------------------------
This email was sent using SquirrelMail.
   "Webmail for nuts!"
http://squirrelmail.org/
_______________________________________________
ncl-talk mailing list
List instructions, subscriber options, unsubscribe:
http://mailman.ucar.edu/mailman/listinfo/ncl-talk