Date: Tue Dec 20 2011 - 12:39:53 MST
Hi,
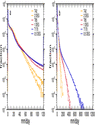
I am having trouble plotting a pdf I calculated using the function pdfx.
On the x-axis I have 120 bins of 10 mm/day each, going from 0 to 1200
mm/day. On the y-axis is the percentage of time, which I would like to
be equally spaced from 10 (top) to 10e-8 (bottom). (See the attached
image from Williamson 2008). Because the values are extremely small or 0
for some of the bins, a log axis (res@trYLog = True) doesn't work.
I've tried using an irregular axis:
res@trYAxisType = "IrregularAxis"
res@trYMinF = 10e-8
res@trYMaxF = 10
res@xyYIrregularPoints =
(/10e-8,10e-7,10e-6,10e-5,10e-4,10e-3,10e-2,10e-1,1,10/)
but then I get an error message
warning:_NhlCreateSplineCoordApprox: Attempt to create spline
approximation for Y axis failed: consider adjusting trYTensionF value
warning:IrTransInitialize: error creating spline approximation for
trYCoordPoints; defaulting to linear
which I looked up and it means the spacing of the coordinate array is
too irregular - but that's how I need it to be. Can I get around this
somehow?
thanks
sara
--
Sara A. Rauscher
(505) 606-0512
T-3 Fluid Dynamics
MS B216
Los Alamos National Lab
Los Alamos, NM 87545 USA
_______________________________________________
ncl-talk mailing list
List instructions, subscriber options, unsubscribe:
http://mailman.ucar.edu/mailman/listinfo/ncl-talk