Date: Fri Dec 16 2011 - 15:55:54 MST
Hello;
I am having an issue using ncl to plot data on an irregular (icosahedral) grid.
The model is FIM, a forecast model under development at NOAA. There is a
template ncl script and test data to plot icosahedral data from Dave Randall
(CSU) provided with the ncl distribution. I tried to follow the format both in
creation of the model data, and the ncl script to plot it, as closely as possible.
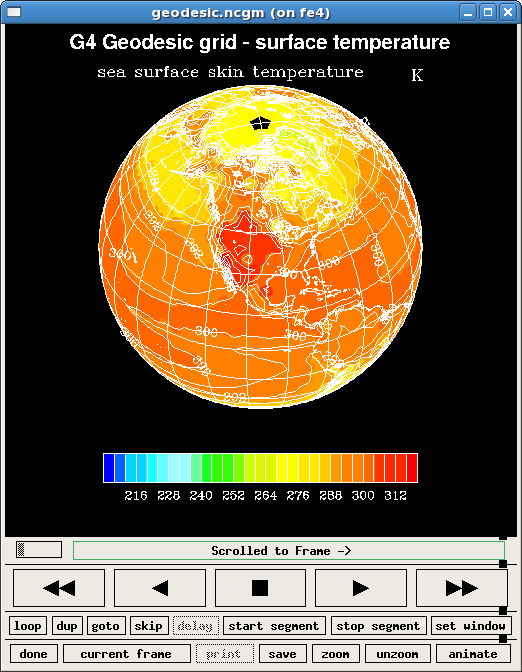
We're 99% of the way there. The attached cgm file shows what appears to be a
correct plot, except data at the north and south poles is strangely blacked out.
I've spoken with the model developers--they've looked at the data and are
convinced that the required values for grid point centers and corner points is
correct. Can anyone help with an explanation of what might be happening and/or
propose a fix? Many thanks in advance.
Regards,
Jim Rosinski
james.rosinski@noaa.gov
FYI, on bluefire:/ptmp/rosinski/fim2nc/testdata, the model input file
"testicos.nc" contains the model data we're plotting. In the same directory,
ploticos.ncl is the ncl script we're using to plot the data. geodesic.ncgm is
the cgm file with the data for the attached plot. geo_1.ncl and geo_2.ncl are
copies of the ncl script to plot Dave Randall's data. Mysteriously, they seem to
work fine on his data.
_______________________________________________
ncl-talk mailing list
List instructions, subscriber options, unsubscribe:
http://mailman.ucar.edu/mailman/listinfo/ncl-talk