Date: Thu Dec 22 2011 - 02:29:33 MST
Hi Mary !
Thanks for nice reply..
>You have a typo in your code. These resources should be "tmYRValues" and "tmYRLabels". The "YR" stands for "Right Y axis".
>However, this still probably won't work.
Yes it does not work..:)
>Your Y axis values are probably in values of pressure, not height, so when you
>provide the list of values for tmYRValues, these need to be pressure values, not height values. I don't understand
>why you have the same height value multiple times
("00","08","16","24","8","16","24"), but you will need to map your
height values >into corresponding
This plot is daily-meridionally-averaged data. Therefore, I have 24 hours data (24 rows) for each longitude (401 coulumn). But to clarify some diurnal characteritics the diurnal cycle is repeated so that the data become 24 x 2 (48 rows) with the same longitude (401 coulumn). Thus, I have the same value multiple times. I read this data from Ascii file, and I add the time and longitude as:
lon = fspan( 80,160, ncols)
lon!0 = "lon"
lon_at_units = "degrees_east"
time = fspan(1, 48, nrows)
time!0 = "time"
time_at_units = "UTC"
data!0 = "time"
data!1 = "lon"
data&time = time
data&lon = lon
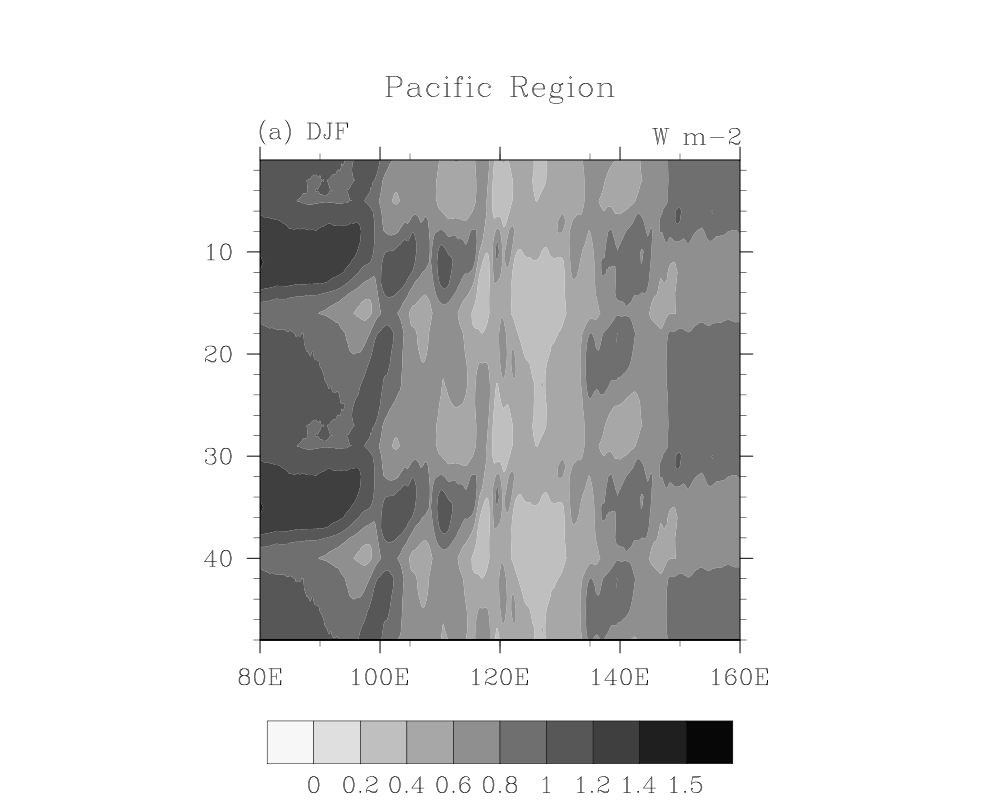
But I need to set the Ythick lable, if not, the Ythick will be like "0, 8, 16, 24, 32, 40, 48" or others, and they do not reflect the time because time must be repeated ("0, 8, 16, 24, 8, 16, 24")..I hope you understand what I mean, please see my rough-plot result to make clear it..
thanks again for best help..
Regards,
Juky
________________________________
From: Mary Haley <haley_at_ucar.edu>
To: juki juki <juky_emc2_at_yahoo.com>
Sent: Wednesday, December 21, 2011 9:58 PM
Subject: Re: Use our own setting for Ythicklabel for Hovmoller diagram
Dear Juky,
You have a typo in your code. These resources should be "tmYRValues" and "tmYRLabels". The "YR" stands for "Right Y axis".
However, this still probably won't work. Your Y axis values are probably in values of pressure, not height, so when you
provide the list of values for tmYRValues, these need to be pressure values, not height values. I don't understand
why you have the same height value multiple times ("00","08","16","24","8","16","24"), but you will need to map your height values into corresponding
pressure values
The way the code for this works internally is that a set of height values are calculated based on pressure values:
hgt = gsn_geop_hgt(ptmp) ; Calculate heights as a function of pressure
And then these height values, which are floating point numbers, are turned into "nice" height values via:
hrange = fabs(hgt(0)-hgt(dimsizes(hgt)-1))
;---Figure out a "nice" spacing to use for the tickmarks
if(hrange.le.35) then
step = 4
else
if(hrange.le.70) then
step = 7
else
step = 10
end if
end if
step = tointeger(step)
; Set range of "nice" hgt values.
hnice = tofloat(ispan(tointeger(floor(hgt(0))), tointeger(ceil(hgt(dimsizes(hgt)-1))),step))
pnice = ftcurv(hgt,ptmp,hnice) ; Get pres vals at nice hgt vals.
Finally, you can use the hnice and pnice values with the tmYRLabels and tmYRValues resources:
res_at_tmYRMode = "Explicit"
res_at_tmYRLabels = hnice
res_at_tmYRValues = pnice
You will need to figure out what pressure values match with the height values you want, and use them in place of "pnice" above.
--Mary
On Dec 21, 2011, at 2:01 AM, juki juki wrote:
Hi all,
>
>
>I am plotting a daily longitude-hovmoller diagram, 24 hours, to clarify the result the data were plotted twice. I want to set the Ythicklable (time) as follow:
>
>
> res_at_trYReverse = True
>
> res_at_tmYBValues = (/0,8,16,24,32,40,48/)
> res_at_tmYBLabels = (/"00","08","16","24","8","16","24"/)
>
>
>Time is generated as:
>
>
> time = fspan(1, 48, nrows); nrows = 48
> time!0 = "time"
> time_at_units = "UTC"
>
> data!0 = "time"; data contain hourly data which are written twice.
> data!1 = "lon"
> data&time = time
> data&lon = lon
>
>
>Problem, some errors said that the above comment (res_at_tmYBValues ...) can not be used for hovmoller case. Are there any suggestion to deal with this kind of problem ?
>
>
>Thanks again for help...
>
>
>Regards,
>JuKy_______________________________________________
>ncl-talk mailing list
>List instructions, subscriber options, unsubscribe:
>http://mailman.ucar.edu/mailman/listinfo/ncl-talk
>
_______________________________________________
ncl-talk mailing list
List instructions, subscriber options, unsubscribe:
http://mailman.ucar.edu/mailman/listinfo/ncl-talk