Date: Thu Jan 05 2012 - 11:38:01 MST
Dear all,
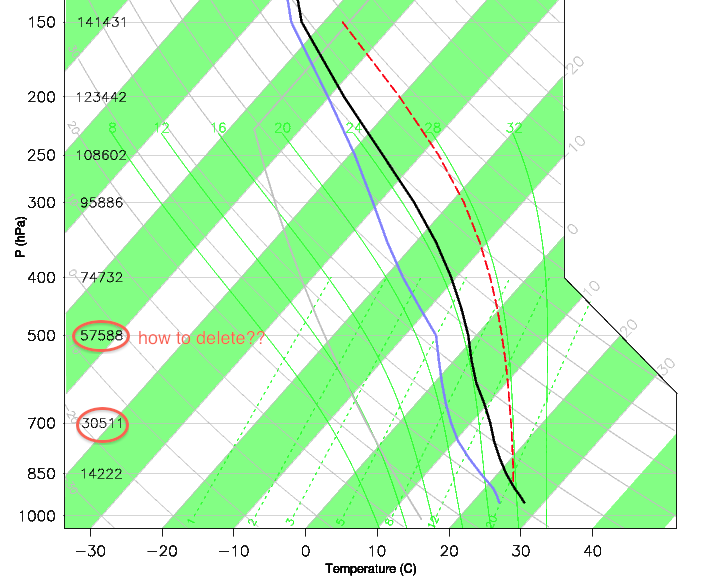
I plot a skew-t diagram by following the examples on NCL home webpage. See attached.
Now I don't want numbers on the isobars (circled by red color). I did several tests to remove them.
But I can not figure out what resources control them.
The resources I used:
skewtOpts = True
skewtOpts@DrawColAreaFill = True ; default is False
skewtOpts@DrawFahrenheit = False
skewtOpts@DrawWind = False
dataOpts = False
If you know how to remove them, please let me know. Thanks.
Guangshan
_______________________________________________
ncl-talk mailing list
List instructions, subscriber options, unsubscribe:
http://mailman.ucar.edu/mailman/listinfo/ncl-talk