Hello Group,
I want to drawing the figures of Eliassen-Palm flux, and the data is calculated by Fortran.
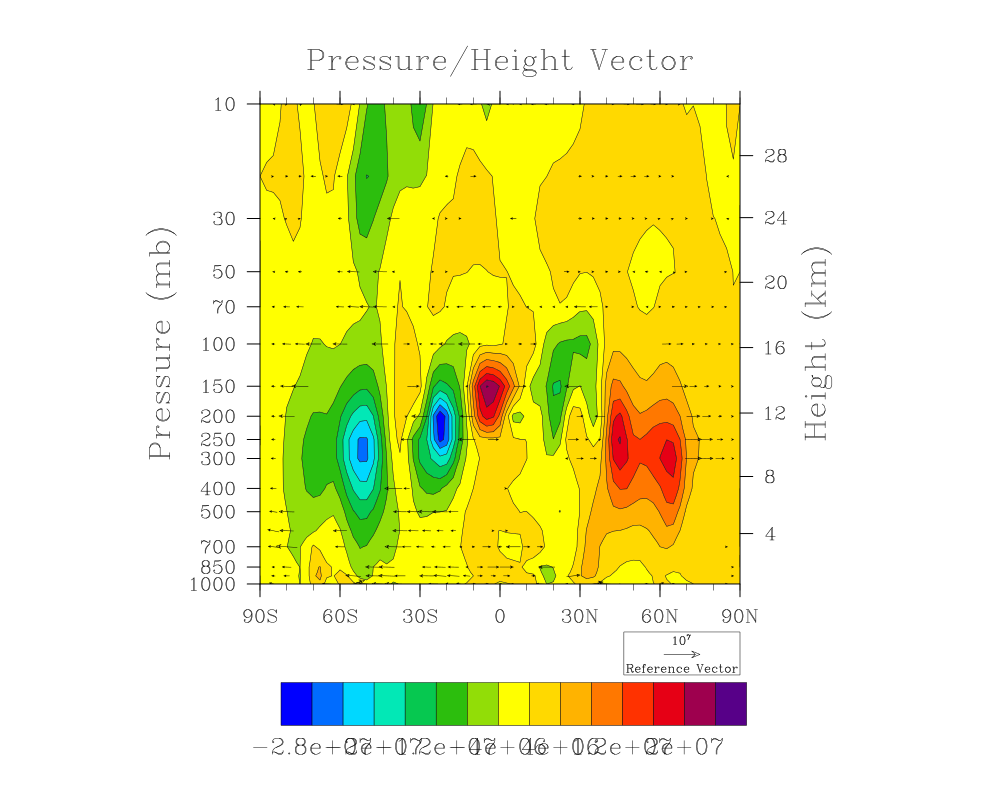
But the vector in some places of figure can't dispaly. The contours of longititude or vertical component are OK. Same problem when use gsn_vector.
I am very puzzled, can anyone help me? Thank You very much!
The scripts as follows, and the figure in attachment.
Jin Dachao
;**********************************************************
load "$NCARG_ROOT/lib/ncarg/nclscripts/csm/gsn_code.ncl"
load "$NCARG_ROOT/lib/ncarg/nclscripts/csm/gsn_csm.ncl"
begin
fili1 = "com_epy(may).grd"
epy = fbindirread (fili1, 0,(/17,73,1/), "float")
epy!0 = "lev"
epy!1 = "lat"
epy!2 = "lon"
lev = (/1000,925,850,700,600,500,400,300,250,200,150,100,70,50,30,20,10/)
lev@units = "hPa"
lev!0 = "lev"
lat = fspan(-90,90,73)
lat@units = "degrees_north"
lat!0 = "lat"
lon = fspan(180,180,1)
lon@units = "degrees_east"
lon!0 = "lon"
epy&lev = lev
epy&lat = lat
epy&lon = lon
;epy@long_name = "ep_flux_lat"
;epy@units = "1"
fili2 = "com_epz(may).grd"
epz = fbindirread (fili2, 0,(/17,73,1/), "float")
epz!0 = "lev"
epz!1 = "lat"
epz!2 = "lon"
epz&lev = lev
epz&lat = lat
epz&lon = lon
;epz@long_name = "ep_flux_lev"
;epz@units = "1"
epz = epz*10
fili3 = "com_epy&epz(may)_test.grd"
t = fbindirread (fili3, 0,(/17,73,1/), "float")
t!0 = "lev"
t!1 = "lat"
t!2 = "lon"
t&lev = lev
t&lat = lat
t&lon = lon
epy@_FillValue = -999
epz@_FillValue = -999
;*********************************************************************************************************
wks = gsn_open_wks ("ps", "vector" ) ; open workstation
gsn_define_colormap(wks,"BlAqGrYeOrRevi200") ; choose color map
res = True ; plot mods desired
res@tiMainString = "Pressure/Height Vector" ; title
res@cnLineLabelsOn = False ; turn off line labels
res@cnFillOn = True ; turn on color fill
res@lbLabelStride = 2 ; every other color
res@gsnSpreadColors = True ; use full range of color map
res@vcRefMagnitudeF = 1e+7 ; define vector ref mag
res@vcRefLengthF = 0.045 ; define length of vec ref
; res@vcGlyphStyle = "CurlyVector" ; turn on curley vectors
res@vcMinDistanceF = 0.01 ; thin out vectors
;*****************************************************
; draw plot
;*****************************************************
plot = gsn_csm_pres_hgt_vector(wks,epy(:,:,{180}),epy(:,:,{180}),epz(:,:,{180}),res )
end
_______________________________________________
ncl-talk mailing list
List instructions, subscriber options, unsubscribe:
http://mailman.ucar.edu/mailman/listinfo/ncl-talk
This archive was generated by hypermail 2.1.8 : Wed Jan 18 2012 - 09:21:55 MST