Date: Mon Jan 23 2012 - 07:19:34 MST
Hello,
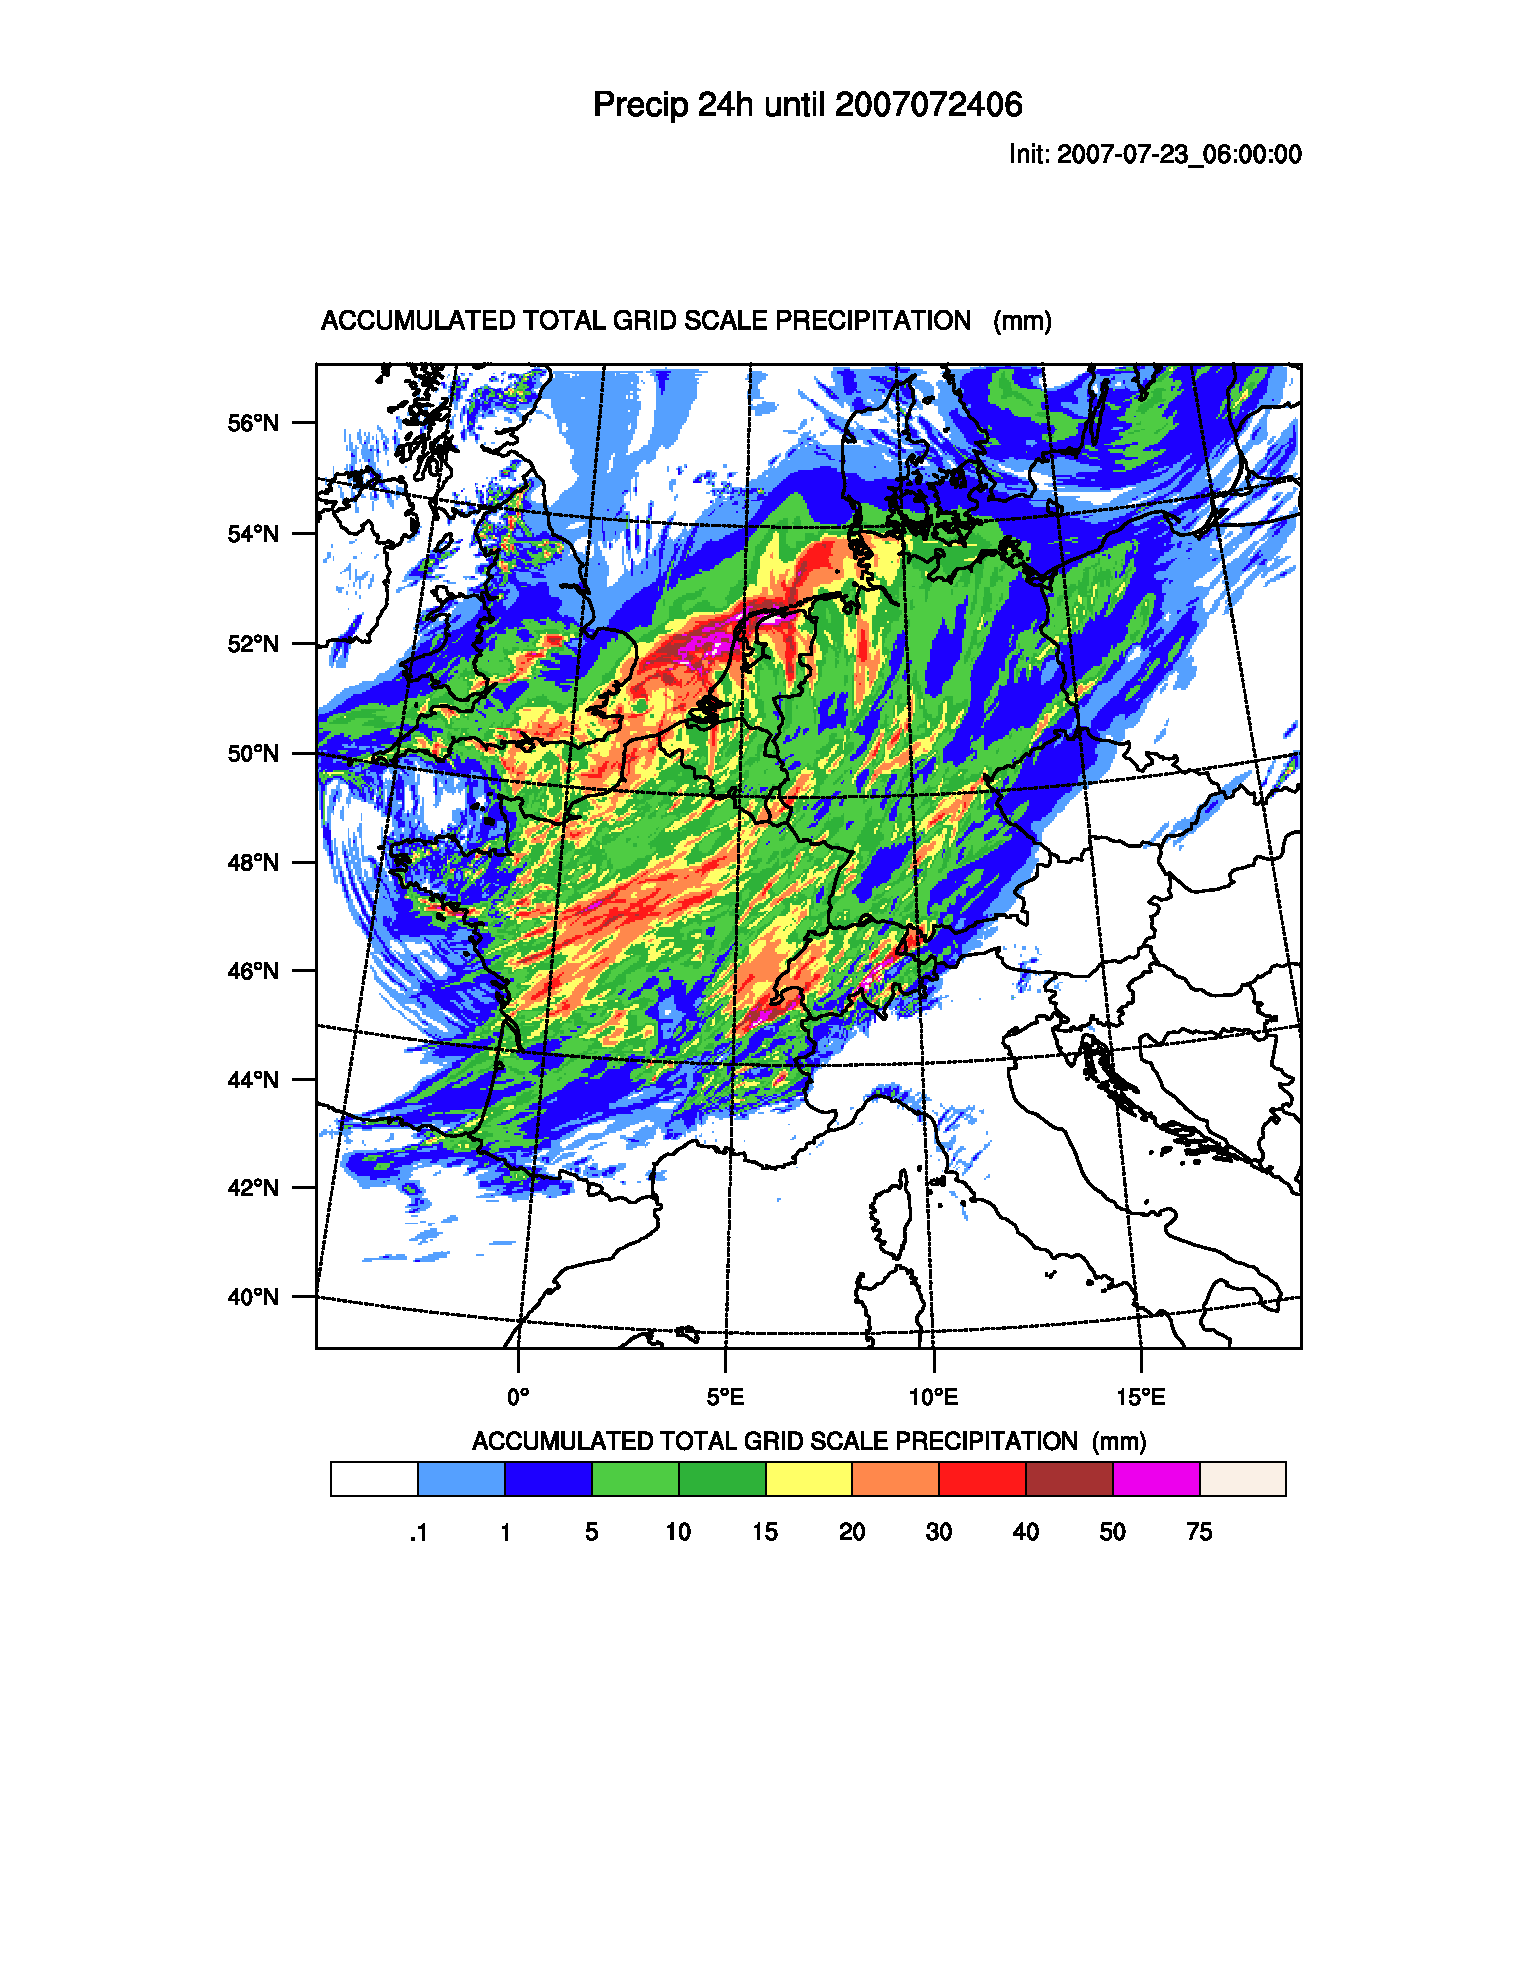
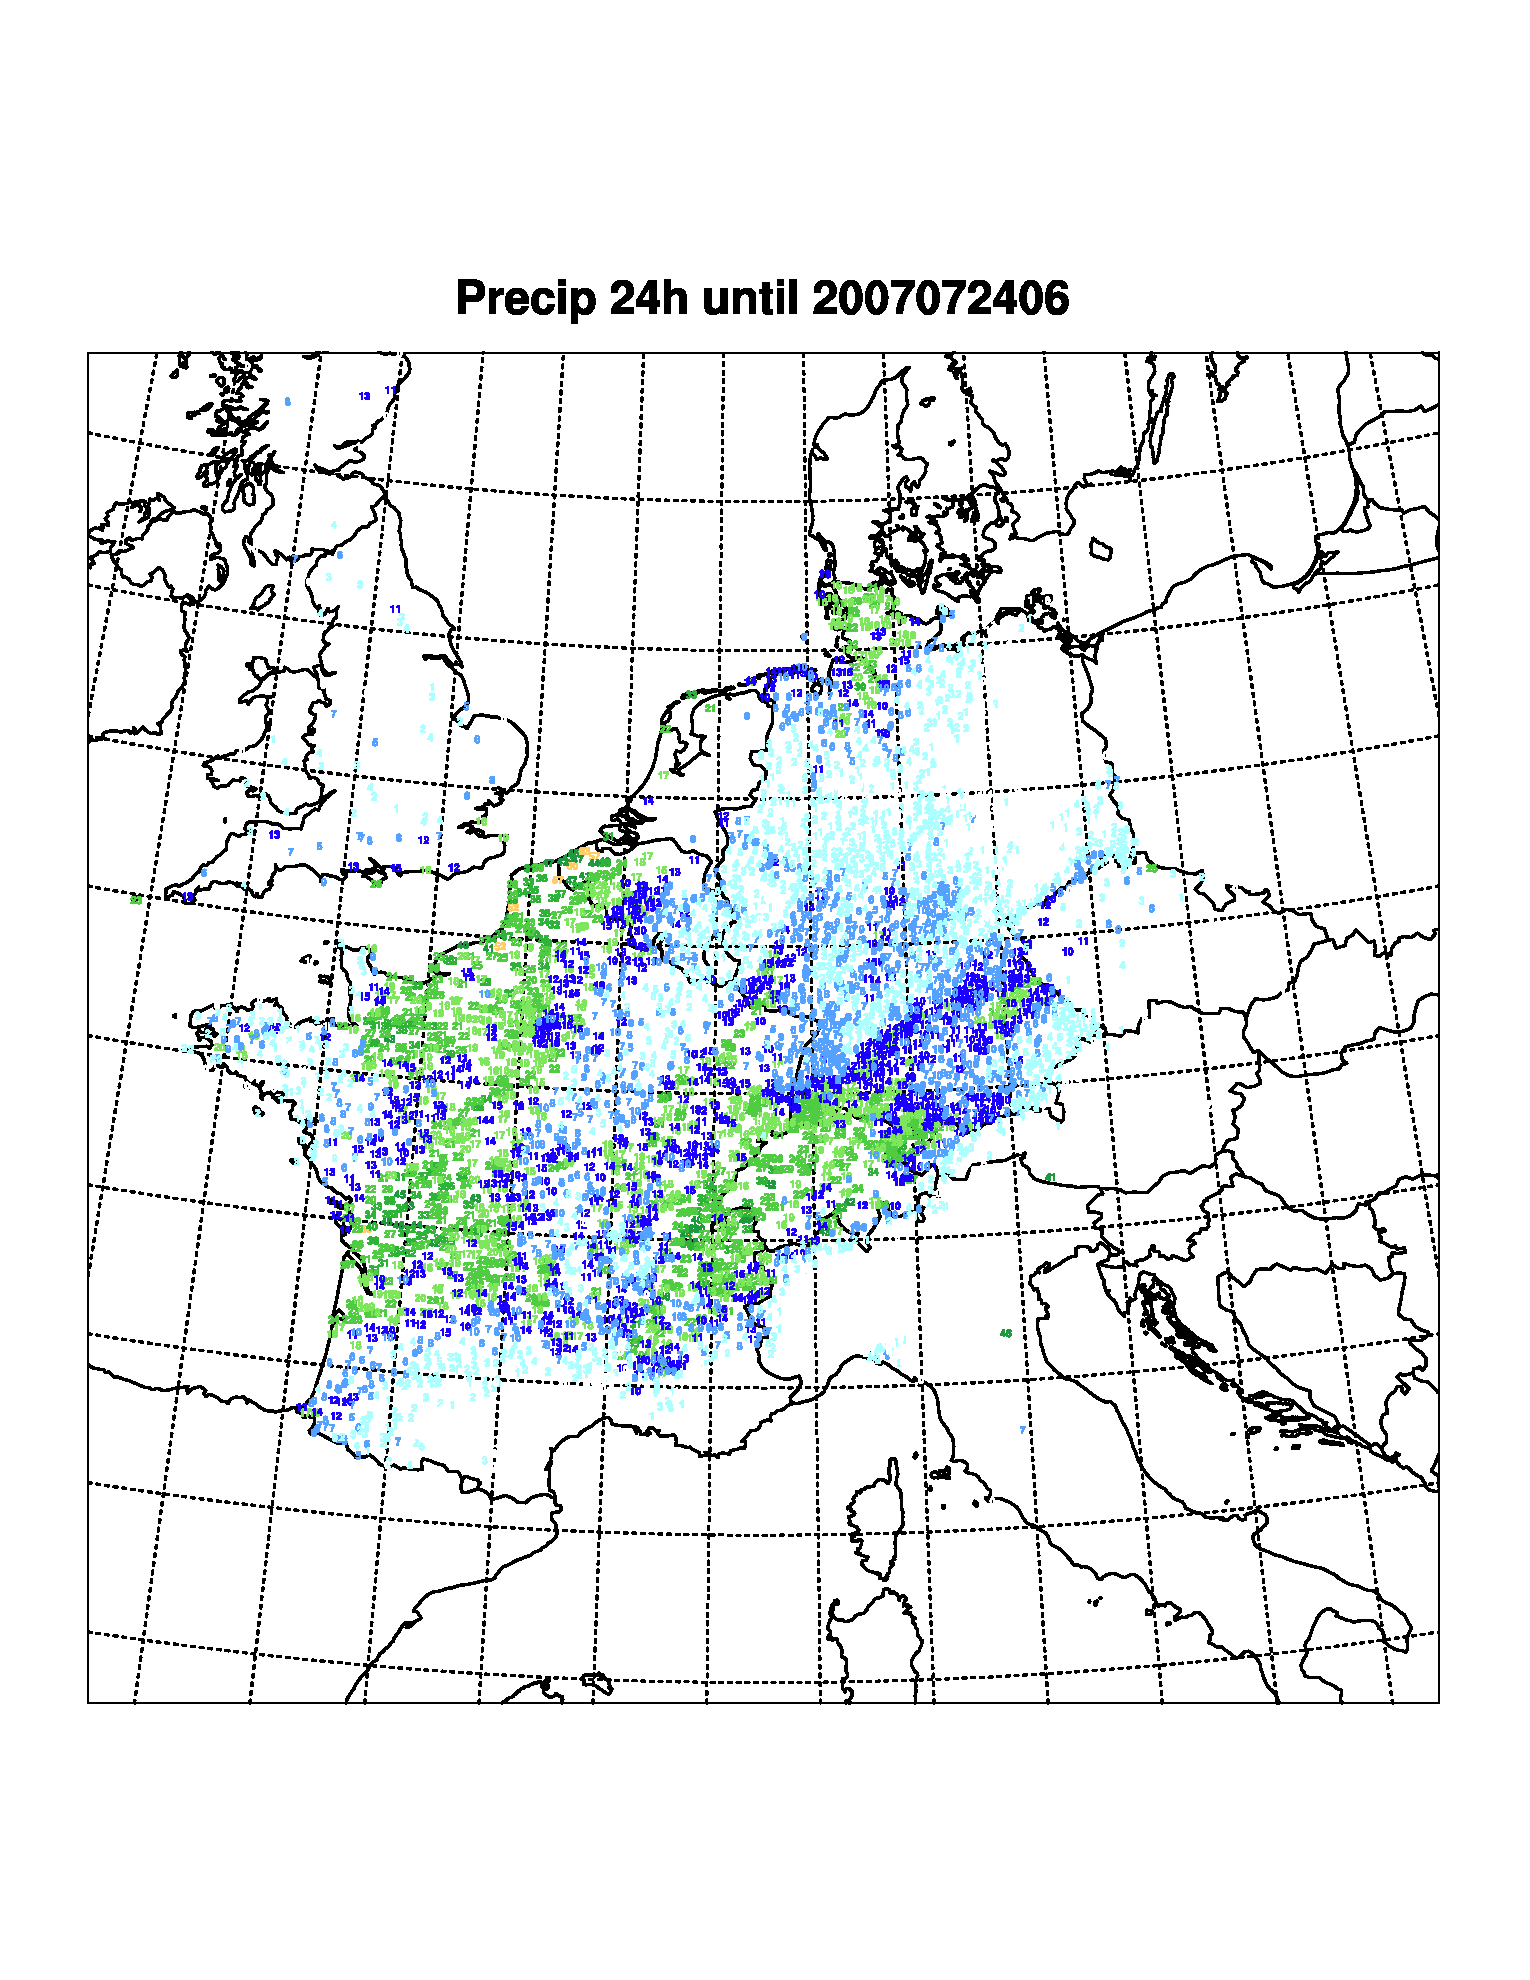
I want to plot station data values as an overlay onto a gridded WRF
field (e.g. precip) using the same colors for the station data and
gridded data field. So far I only got both fields on separate images
with different colors.
My scripts looks as follows:
load "$NCARG_ROOT/lib/ncarg/nclscripts/csm/gsn_code.ncl"
load "$NCARG_ROOT/lib/ncarg/nclscripts/csm/gsn_csm.ncl"
load "$NCARG_ROOT/lib/ncarg/nclscripts/csm/contributed.ncl"
load "$NCARG_ROOT/lib/ncarg/nclscripts/wrf/WRFUserARW.ncl"
begin
wks = gsn_open_wks("pdf" ,"precip_jdc_2007072406_noradar") ;
ps,pdf,x11,ncgm,eps
gsn_define_colormap(wks,"prcp_1")
;gsn_reverse_colormap(wks)
all_files = systemfunc ("ls wrf_files/wrfout_d01_2007-07-24_06:00:00")
numFILES = dimsizes(all_files)
; Set some Basic Plot options
res = True
; res@MainTitle = getenv("EXPERIMENT")
res@Footer = False
res@cnFillMode="RasterFill"
mpres = True
mpres@gsnMaximize = True ; Maximize plot in
frame.
mpres@gsnDraw = False
mpres@gsnFrame = False ; Don't advance the
frame
pltres = True
mpres = True
res = True
mpres@mpGeophysicalLineColor = "Black"
mpres@mpNationalLineColor = "Black"
mpres@mpUSStateLineColor = "Black"
mpres@mpGridLineColor = "Black"
mpres@mpLimbLineColor = "Black"
mpres@mpPerimLineColor = "Black"
mpres@mpGeophysicalLineThicknessF = 2.0
mpres@mpGridLineThicknessF = 2.0
mpres@mpLimbLineThicknessF = 2.0
mpres@mpNationalLineThicknessF = 2.0
mpres@mpUSStateLineThicknessF = 2.0
mpres@gsnMaximize = True ; Maximize plot in
frame.
mpres@mpOutlineBoundarySets = "AllBoundaries"; turn on states
mpres@mpDataBaseVersion = "mediumres" ; select
database
mpres@mpDataSetName = "Earth..4"
mpres@mpFillOn = False
mpres@mpLandFillColor = "gray"
; mpres@tfDoNDCOverlay = True
; mpres@mpLimitMode = "Corners"
; mpres@mpLeftCornerLatF = 45.
; mpres@mpLeftCornerLonF = -2.
; mpres@mpRightCornerLatF = 56.
; mpres@mpRightCornerLonF = 15.
mpres@mpGridAndLimbOn = True
mpres@mpGridLineDashPattern = 2
mpres@mpGridLineDashSegLenF = 0.06 ; default 0.15
mpres@mpGridLonSpacingF = 2.
mpres@mpGridLatSpacingF = 2.
; Title resources:
mpres@tiMainString = "Precip 24h until 2007072406"
;mpres@tiMainOwrf_filesetYF = 0.0 ; Move the
title down.
mpres@tiMainFontHeightF = 0.015
do ifil = 0,numFILES-1
a = addfile(all_files(ifil)+".nc","r")
; What times and how many time steps are in the data set?
times = wrf_user_list_times(a) ; get times in the file
; times2 = wrf_user_list_times(b)
ntimes = dimsizes(times) ; number of times in the file
rain_exp = wrf_user_getvar(a,"RAINNC",0)
; Plotting options for Precipitation
opts_r = res
opts_r@UnitLabel = "mm"
opts_r@cnLevelSelectionMode = "ExplicitLevels"
opts_r@cnLevels=(/0.1,1.,5.,10.,15.,20.,30.,40.,50.,75./)
colors = (/2,3,4,5,6,7,8,9,11/)
;gsn_define_colormap(wks, colors)
opts_r@cnInfoLabelOn = False
opts_r@cnConstFLabelOn = True
opts_r@cnFillOn = True
contour_res = wrf_contour(a,wks,rain_exp,opts_r) ; exp (color)
; ; Total Precipitation Tendency + SLP
plot = wrf_map_overlays(a,wks,(/contour_res/),pltres,mpres)
;;;; for JDC
directory =
"/taifun/D-PHASE_data/latest_data_full_year/terminfiles_neu_0310_0707/"
all_files_jdc = systemfunc ("ls " + directory +
"20070724*_precip_24h.asc_ncl")
numFILES_jdc = dimsizes(all_files)
do ifil = 0,numFILES_jdc-1
filestring = all_files_jdc(ifil)
print(filestring)
lines = numAsciiRow(all_files_jdc(ifil))
columns = numAsciiCol(all_files_jdc(ifil))
z = asciiread(all_files_jdc(ifil),(/lines,columns/), "float")
z@_FillValue = -9990.
lat = z(:,0)
lon = z(:,1)
; new
precip=z(:,2)
precip@_FillValue=-999.
if ( a@MAP_PROJ .eq. 1 ) then
mapproj = "LambertConformal"
truelat1 = a@TRUELAT1
truelat2 = a@TRUELAT2
clon = a@STAND_LON
end if
dsizes = getfiledimsizes(a)
nx = dsizes(2)
ny = dsizes(3)
xlat=a->XLAT
xlon=a->XLONG
lat_ll = xlat(0,0,0)
lat_ur = xlat(0,ny-1,nx-1)
lon_ll = xlon(0,0,0)
lon_ur = xlon(0,ny-1,nx-1)
mpres@mpProjection = mapproj ; choose projection
if ( mapproj .eq. "LambertConformal" ) then
mpres@mpLambertParallel1F = truelat1 ; two parallels
mpres@mpLambertParallel2F = truelat2
mpres@mpLambertMeridianF = clon ; central meridian
end if
if ( mapproj .eq. "Stereographic" ) then
mpres@mpCenterLatF = clat
mpres@mpCenterLonF = clon
end if
mpres@mpLimitMode = "Corners"
mpres@mpLeftCornerLatF = lat_ll
mpres@mpLeftCornerLonF = lon_ll
mpres@mpRightCornerLatF = lat_ur
mpres@mpRightCornerLonF = lon_ur
map = gsn_csm_map(wks,mpres)
gsn_define_colormap(wks,"prcp_1")
delete(colors)
colors = new(9,"string")
colors = (/2,3,4,5,6,7,8,9,11/)
values = new(10,"float")
values = (/0.1,1.,5.,10.,15.,20.,30.,40.,50.,75./)
do level = 0, 8
lon1 = new((/dimsizes(lon)/),"float")
lat1 = new((/dimsizes(lat)/),"float")
precip1 = new((/dimsizes(precip)/),"float")
m = 0
do n = 0, dimsizes(precip)-1
if
(precip(n).gt.values(level).and.precip(n).lt.values(level+1)) then
lon1(m) = lon(n)
lat1(m) = lat(n)
precip1(m) = precip(n)
m = m + 1
end if
end do
if(m.gt.0) then
txres = True
txres@txFontHeightF = 0.005
txres@txFontColor = colors(level)
txres@txFont = "helvetica-bold"
text =
gsn_add_text(wks,map,sprintf("%3.0f",precip1(0:m-1)),lon1(0:m-1),lat1(0:m-1),txres)
delete(txres)
delete(text)
end if
delete(lon1)
delete(lat1)
delete(precip1)
end do
draw(map) ; Drawing the XY plot will also draw the lines we just
added.
frame(wks)
delete(z)
delete(lat)
delete(lon)
delete(precip)
delete(lines)
end do ;JDC files
;; end do ; END OF TIME LOOP
nt_start = 0
end do ; file loop
end
Attached please find the resulting images.
Thomas
--
*******************************************
*Thomas Schwitalla                      *
*Institute of Physics and Meteorology   *
*University of Hohenheim                *
*Garbenstrasse 30                       *
*70599 Stuttgart                        *
*Germany                                *
*Tel.: +49 711 459 22145                *
*****************************************
_______________________________________________
ncl-talk mailing list
List instructions, subscriber options, unsubscribe:
http://mailman.ucar.edu/mailman/listinfo/ncl-talk