Date: Tue Jan 24 2012 - 14:43:26 MST
Hi,
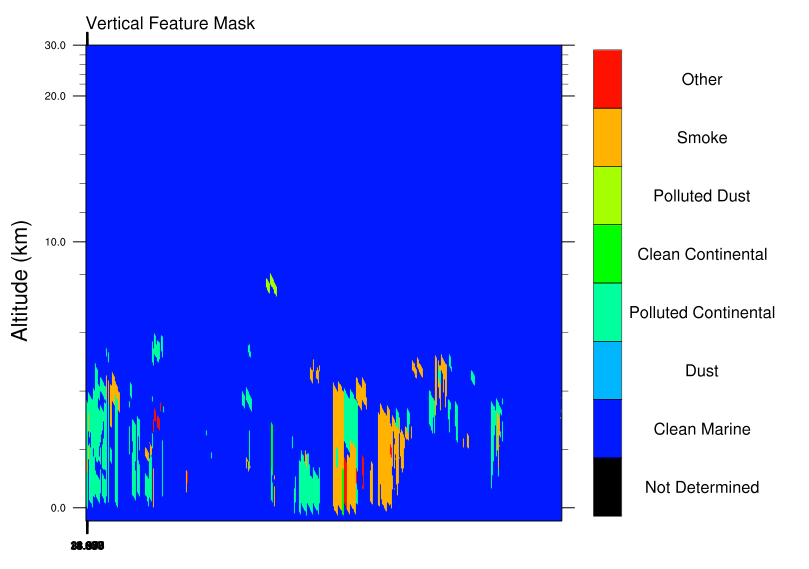
I am trying to do a contour plot. The data is two dimension. The y-axis is altitude and x-axis is latitude. My y-axis tick marks gets labled properly. However my x-axis tick marks lables are written one on top of the other (please see attached figure). I tried all possibilities and could not figure out. I would appreciate your help here.
Here is the part of my program that I use to lable my tick marks.
;---Tickmark resources
latstep = 73
res@tmXBMode = "Explicit"
res@tmXBValues = lat1d(::latstep)
res@tmXBLabels = sprintf("%5.2f",lat1d(::latstep)) + "~C~" + \
sprintf("%5.2f",lon1d(::latstep))
res@tmXBLabelFontHeightF = 0.01
res@tmEqualizeXYSizes = True ; make sure labels same size
Thanks in advance.
Starry
_______________________________________________
ncl-talk mailing list
List instructions, subscriber options, unsubscribe:
http://mailman.ucar.edu/mailman/listinfo/ncl-talk