Date: Wed Feb 08 2012 - 15:33:10 MST
Hi Elody,
After experimenting with your plot script, it's apparent that you stumbled into a a difficulty that even experienced users might have trouble with. The issue is that the default for gsn_csm_map is to
turn off the continental outlines and just fill the land areas with a gray color. The problem is that you set the colormap to a color table called "gui_default", which has no gray color. When gray is specified for the land areas, NCL uses the nearest match in RGB space. That turns out to be white in this case, meaning that you end up with no visible map elements in your plot.
The most straightforward solution in this case is to add the color gray to the color table, like this:
i = NhlNewColor(wks,.7,.7,.7)
(the variable 'i' will be the index of this color, but you do not need to save it)
FYI, the next version of NCL will eliminate this problem for most output workstations, because the restriction on the total number of colors is being removed. Any color specified explicitly will now show up exactly as specified.
I see you have
res@mpOutlineBoundarySets = "AllBoundaries"
but if you actually want to see the outlines you will also need to set
res@mpOutlineOn = True
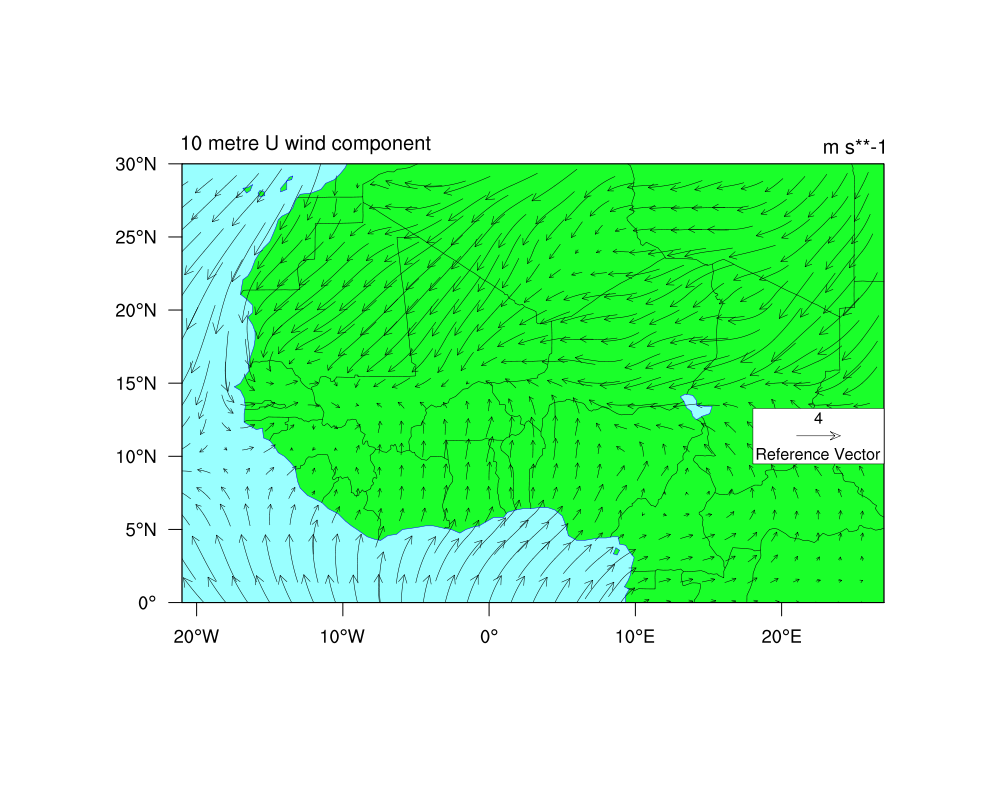
You can get a more colorful picture using resources like:
res@mpLandFillColor = "green"
res@mpOceanFillColor = "lightblue"
res@mpInlandWaterFillColor = "lightblue"
Also just FYI:
You misspelled
vres@vcRefLengthF (the t and h are reversed)
and although I do not think the gsnAddCyclic resource is needed for your plot, if you want to set it you should apply it to the gsn_csm_vector call rather than the gsn_csm_map call in order to
eliminate the error you are getting.
I am attaching a png and a modified version of your code.
Hope this helps,
-dave
On Feb 6, 2012, at 2:00 PM, David Brown wrote:
> Without seeing the output plot or having access to the data, it's a little hard to figure out what is going on, but one question is: do you see the correct coordinate ranges as tickmark labels when you draw the vector plot by itself? Are your coordinate variables a single dimension or 2 dimensions? My guess is that you have not set up the coordinate values correctly. If your coordinates are 1D
> then they should be set using the coordinate syntax, not attribute syntax:
>
> Not this:
> x@latitude = f->latitude
>
> But this:
>
> x!1 = "latitude" ; this is assuming the un-reordered dimension order of time x lat x lon.
> x&latitude = f->latitude
>
> Maybe that will help.
> -dave
>
>
>
>
> On Feb 6, 2012, at 1:02 PM, elodyfluck@orange.fr wrote:
>
>> Hello NCL users,
>>
>> I would like to overlay wind vectors on a map. I used "vectors_ncl" scripts examples in guidance, but my problem is still present: In fact, I have just my vector plot but it isn't overlay on a map.
>> I think that I don't use the function overlay properly, so do you have any suggestion?
>> Data used are ERA Interim surface reanalyses.
>>
>> Thanks in advance
>>
>> Elody Fluck
>>
>>
>>
>> load "$NCARG_ROOT/lib/ncarg/nclscripts/csm/gsn_code.ncl"
>>>> load "$NCARG_ROOT/lib/ncarg/nclscripts/csm/gsn_csm.ncl"
>>>> load "$NCARG_ROOT/lib/ncarg/nclscripts/csm/contributed.ncl"
>>>>
>>>> begin
>>>>
>>>> plot = new((/1/),"graphic")
>>>>
>>>> f = addfile("/archive/crct/shared/ERA_INTERIM/SURFACE"+"/erai_sfc_1995_10.nc","r")
>>>>
>>>> x = short2flt(f->u10)
>>>> ;printVarSummary(x)
>>>> t = lonFlip(x); reorder
>>>> ;printVarSummary(t)
>>>> x@latitude = f->latitude
>>>> x@longitude = f->longitude
>>>>
>>>> v = t(latitude|:,longitude|:,time|:)
>>>> ;printVarSummary(v)
>>>>
>>>> a = v({0:30},{-21:27},:); coordinate subscripting
>>>> ;printVarSummary(a)
>>>>
>>>>
>>>> vv = dim_avg_Wrap(a)
>>>>
>>>> printVarSummary(vv)
>>>> print(min(vv)+" "+max(vv))
>>>>
>>>>
>>>>
>>>> ff = addfile("/archive/crct/shared/ERA_INTERIM/SURFACE"+"/erai_sfc_1995_10.nc","r")
>>>>
>>>> xmw = short2flt(ff->v10)
>>>> ;printVarSummary(xmw)
>>>> tmw = lonFlip(xmw); reorder
>>>> ;printVarSummary(tmw)
>>>>
>>>> vmw = tmw(latitude|:,longitude|:,time|:)
>>>> ;printVarSummary(vmw)
>>>> xmw@latitude = f->latitude
>>>> xmw@longitude = f->longitude
>>>>
>>>> amw = vmw({0:30},{-21:27},:); coordinate subscripting
>>>> ;printVarSummary(amw)
>>>>
>>>>
>>>> vvmw = dim_avg_Wrap(amw)
>>>>
>>>> printVarSummary(vvmw)
>>>> print(min(vvmw)+" "+max(vvmw))
>>>>
>>>>
>>>>
>>>
>>>> wks = gsn_open_wks("ps","dirwind9697zoom")
>>>> setvalues wks
>>>> "wkColorMap" : "gui_default"
>>>> end setvalues
>>>>
>>>> res = True
>>>> res@gsnDraw= False
>>>> res@gsnFrame = False
>>>> res@gsnMaximize = True
>>>>
>>>> res@gsnAddCyclic = False
>>>> ;Zoom on Sahel
>>>> res@mpLimitMode = "Corners"
>>>> res@mpLeftCornerLatF = 0
>>>> res@mpLeftCornerLonF = -21
>>>> res@mpRightCornerLatF = 30
>>>> res@mpRightCornerLonF = 27
>>>>
>>>> res@mpCenterLonF = (res@mpRightCornerLonF-res@mpLeftCornerLonF)/2
>>>>
>>>> res@tfDoNDCOverlay = True
>>>>
>>>> res@mpGeophysicalLineColor = 2
>>>> res@mpPerimOn = True
>>>> res@mpGridLineDashPattern = 2
>>>> res@mpOutlineBoundarySets = "AllBoundaries"
>>>> res@mpUSStateLineColor = "black"
>>>> res@pmTickMarkDisplayMode = "Always"
>>>> res@lbLabelBarOn =False
>>>>
>>>> ; Create vectors
>>>>
>>>> vres= True
>>>> vres@vcGlyphStyle = "CurlyVector"
>>>> vres@vcRefMagnitudeF = 4.0 ; define vector ref mag
>>>> vres@vcRefLenghtF = 0.045 ; define lenght of vector ref
>>>> vres@vcRefAnnoOrthogonalPosF = -0.535 ; move ref vecor
>>>> res@vcRefAnnoArrowLineColor = "black" ; change ref vector color
>>>> ;vres@vcRefAnnoArrowUseVecColor = False ; don't use vec color for ref
>>>> ;vres@vcLineArrowColor = "white"
>>>> ;vres@vcLineArrowThicknessF = 2.0
>>>> ;vres@vcVectorDrawOrder = "PostDraw"
>>>>
>>>> map = gsn_csm_map(wks,res)
>>>> plot(0) = gsn_csm_vector(wks,vv,vvmw,vres)
>>>> overlay(map,plot(0))
>>>>
>>>> draw(map)
>>>> frame(wks)
>>>>
>>>>
>>>> end_______________________________________________
>> ncl-talk mailing list
>> List instructions, subscriber options, unsubscribe:
>> http://mailman.ucar.edu/mailman/listinfo/ncl-talk
>
_______________________________________________
ncl-talk mailing list
List instructions, subscriber options, unsubscribe:
http://mailman.ucar.edu/mailman/listinfo/ncl-talk
- application/octet-stream attachment: elody.ncl