Date: Mon Feb 27 2012 - 04:52:18 MST
Dear ncl help,
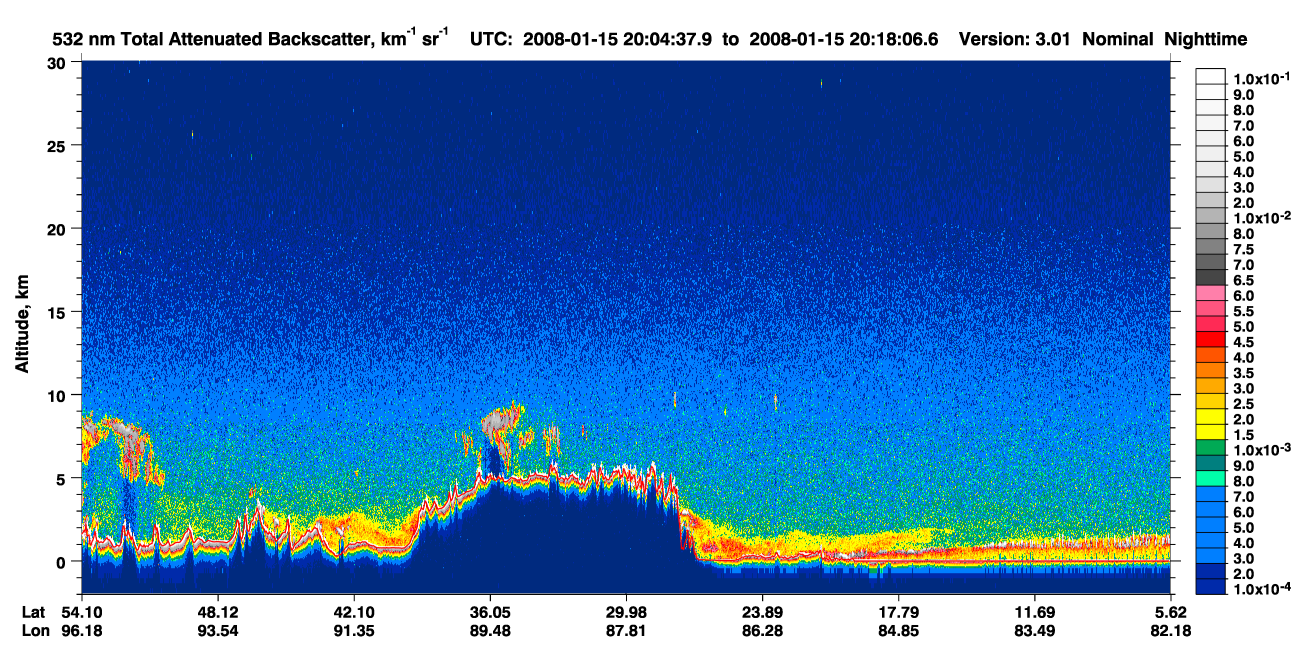
Sorry to bother you by this email. It is regarding the plotting for CALIOP
532nm attenuated backscatter. Attachment 1 is the image on the CALIPSO
website, attachment 2 is the plot I created myself. I have one question
here, how can I make the label information into scientific notation (as
shown by the official image)? I have tried something like
res@cnInfoLabelFormat = "*+^g", but it made no change to my figure. What
could be the right way to do that? (I've also provided my script as
attachment 3)
Thanks very much for your help!
Cheers,
Vivian
_______________________________________________
ncl-talk mailing list
List instructions, subscriber options, unsubscribe:
http://mailman.ucar.edu/mailman/listinfo/ncl-talk
- application/postscript attachment: 1064_Attenuated_Backscatter_13460.ps
- application/octet-stream attachment: plot_Total_Attenuated_Backscatter_backward.ncl