You would need to send us your script and the necessary data (or a link to an accessible data server) for us to help you.
See the "Report bugs" page under Support on the NCL web site for instructions on uploading scripts and dasta.
-dave
On Mar 26, 2012, at 4:11 PM, Jeff Steward wrote:
> Hello,
>
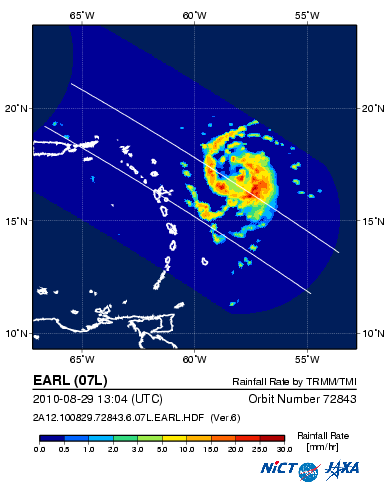
> I need to plot level 1B data (brightness temperatures) from TRMM/TMI,
> and I have had some measure of success using gsn_csm_contour_map.
> However, each scan by TRMM is conical, and thus it creates a
> non-convex path, like this:
>
> http://sharaku.eorc.jaxa.jp/ADEOS2/JAXA_TYP_DB/TYP_DB_TRMM/201008/07L/2A12.100829.72843.6.07L.EARL.png
>
> However, when I plot this with gsn_csm_contour_map, the concave
> portion of the scan (the "U" shape at the back of the swath) is filled
> in with interpolated, very poor quality values; I would much rather
> just leave those values out. As an example, over land the values
> should obviously be around 300 K; with the interpolated values, the
> temperature of the ocean and the land are mixed together. Any ideas
> about how I can make my plot more like the sharaku link above?
>
> Thank you for your time. Best wishes,
>
> Jeff
> _______________________________________________
> ncl-talk mailing list
> List instructions, subscriber options, unsubscribe:
> http://mailman.ucar.edu/mailman/listinfo/ncl-talk
_______________________________________________
ncl-talk mailing list
List instructions, subscriber options, unsubscribe:
http://mailman.ucar.edu/mailman/listinfo/ncl-talk
Received on Mon Mar 26 17:57:51 2012
This archive was generated by hypermail 2.1.8 : Tue Mar 27 2012 - 08:50:24 MDT