Date: Fri Mar 23 2012 - 12:49:43 MDT
Hi,
I am creating a panel of zonal plots (25 in all). I want to get rid of
some of the details that show up on each of the plot. I was successful
in most but there are a few that I am not sure how to.
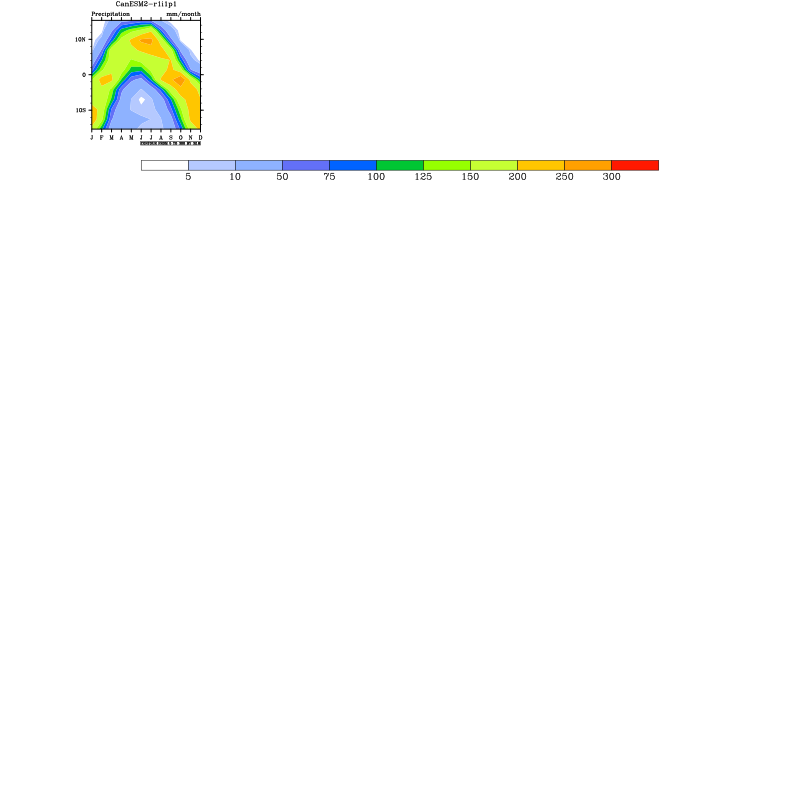
A sample script and plot are attached.
1. remove the plot heading (Precipitation mm/month) and add this info
just below the legend
2. restrict the latitude range to -12 to 10 (in the actual data
selection the range is ~ -15 to 12)
3. remove the contour labels and its legend at the right bottom of each plot
4. Add row and column titles. Column names as
(/"CM1","CM2","CM3","CM4","CM5"/) and row names as
(/"R1","R2","R3","R4",R5"/)
Thank you in advance,
Noel
_______________________________________________
ncl-talk mailing list
List instructions, subscriber options, unsubscribe:
http://mailman.ucar.edu/mailman/listinfo/ncl-talk
- text/plain attachment: zonal_plot_test.ncl