Date: Fri Apr 27 2012 - 23:56:28 MDT
Hi,
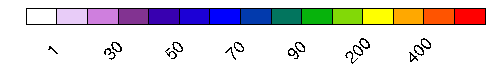
I tried to plot a color contour figure using wrf_contour and explicit color
level. However, as shown in the attachment, instead of showing all the
values, the colorbar only shows half levels. Could anyone help me with this
problem? Many thanks in advance.
Zheng
code:
wks = gsn_open_wks("x11", "wrf")
gsn_define_colormap(wks,"prcp_3")
res = True
res@cnFillOn = True ; color fill
res@cnLinesOn = False ; Turn off contour lines
res@cnLevelSelectionMode = "ExplicitLevels"
res@lbLabelAngleF = 45
plevel = (/1, 20, 30,40,50,60,70,80,90,100,200,300,400,800/)
pcolor = (/4,5,6,7,8,9,10,11,12,13,14, 15,16,17,18, 24,25,26/)
res@cnLevels = plevel
res@cnFillColors =pcolor
res@cnInfoLabelOn = False
res@cnConstFLabelOn = False
res@cnFillOn = True
res@NoHeaderFooter=True
res@InitTime=False
res@FieldTitle=""
res@Footer = False
res@gsnDraw =False
res@gsnFrame=False
contour = wrf_contour(b,wks,lwp,res)
pltres = True ; Set plot options
mpres = True ; Set map options
pltres@FramePlot=False
pltres@NoTitles=True
pltres@CommonTitle=False
pltres@PanelPlot=True
mpres@mpGeophysicalLineColor = "Black" ; Overwrite basic map
settings
mpres@mpGridLineColor = "Black"
mpres@mpLimbLineColor = "Black"
mpres@mpNationalLineColor = "Black"
mpres@mpPerimLineColor = "Black"
mpres@mpGridAndLimbOn = True ; turn on lat/lon lines
mpres@mpTickMarkDisplayMode = "Always" ; turn on automatic tickmarks
mpres@mpGridLineThicknessF =1.2
mpres@mpGridSpacingF= 5
plot = wrf_map_overlays(b,wks,(/contour/),pltres,mpres) ; Plot the data
over a map background
draw(plot)
frame(wks)
end
_______________________________________________
ncl-talk mailing list
List instructions, subscriber options, unsubscribe:
http://mailman.ucar.edu/mailman/listinfo/ncl-talk