Date: Thu Apr 26 2012 - 22:05:56 MDT
Hi Guilherme,
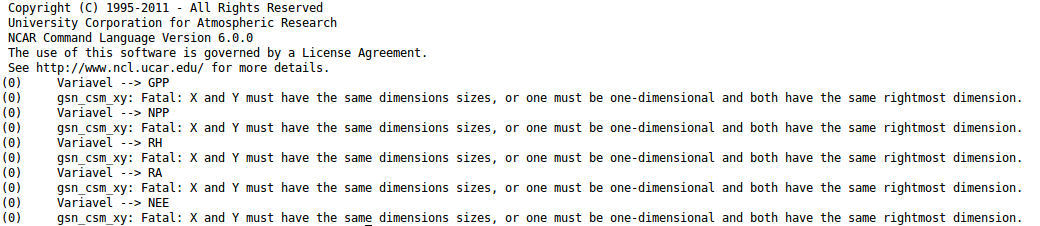
This error means that the sizes of the variables used for axis X and Y do
not match.
I've put the following line before the use of gsn_csm_xy:
print(dimsizes(yyyyfrac)+" "+dimsizes(data1))
And I've had, for each loop, the same response:
(0) 144 3
(1) 144 59
If you run dimsizes only for yyyyfrac you'll have just 144. So your X axis
have 144 points. But, running dimsizes only for data1,
you'll have 3 and 59, meaning that you have 2 columns (or series) that you
want to plot. However, any of them has the same size of the X axis.
In other words, your data used for X and Y axis haven't the same size!
Best regards,
Mateus
Em 27 de abril de 2012 00:50, Guilherme Martins <jgmsantos@gmail.com>escreveu:
> Hi users!
>
> Please,
>
> I need a help. I'm trying to plot a figure but I received this message
> below.
>
> I suppose yyyyfrac have one dimension and data1 have 2 dimensions. How can
> I resolve it?
>
> Anyone help me?
>
> My files are in attach.
>
> Thanks a lot!
>
> Guilherme.
>
> [image: Imagem inline 1]
>
> lkçkçlkç
>
> --
> *Guilherme Martins*
> http://guilhermemartins.hd1.com.br/
>
>
>
>
> _______________________________________________
> ncl-talk mailing list
> List instructions, subscriber options, unsubscribe:
> http://mailman.ucar.edu/mailman/listinfo/ncl-talk
>
>
_______________________________________________
ncl-talk mailing list
List instructions, subscriber options, unsubscribe:
http://mailman.ucar.edu/mailman/listinfo/ncl-talk