Dear All;
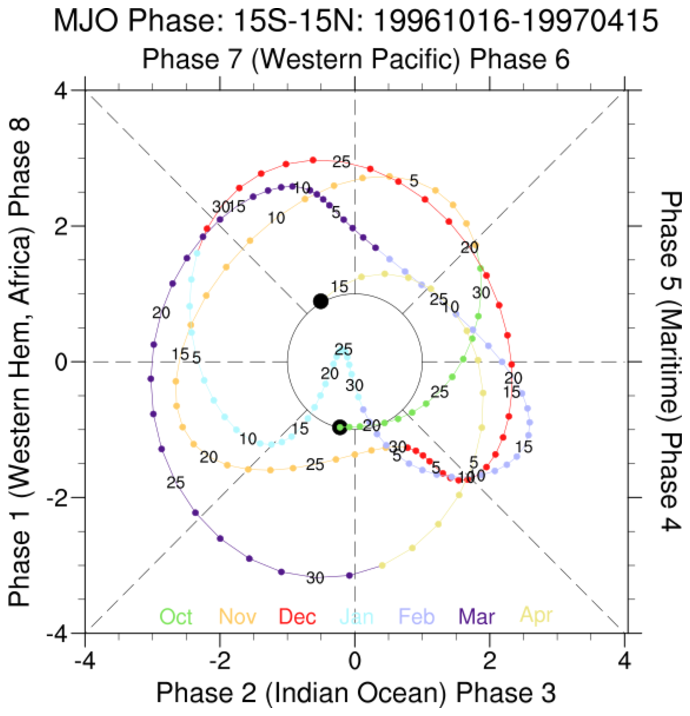
As my previous email that I would like to plot MJO phase diagram by usinghttp://www.ncl.ucar.edu/Applications/Scripts/mjoclivar_15.ncl. To see the performance of the code, first I plot same data period as in the website. The result is very different from the example (http://www.ncl.ucar.edu/Applications/Images/mjoclivar_15_lg.png) in which the location of all MJO phases for all months is different from that in the website.
Thus, my MJO_PC_INDEX.nc may NOT be correct. As we know the input of mjoclivar_15.ncl is MJO_PC_INDEX.nc which is creted by http://www.ncl.ucar.edu/Applications/Scripts/mjoclivar_14.ncl. Moreover, the input of http://www.ncl.ucar.edu/Applications/Scripts/mjoclivar_14.ncl are:
filolr = "olr.day.anomalies.1980-2012.nc"
filu200 = "uwnd.day.200.anomalies.1980-2012.nc"
filu850 = "uwnd.day.850.anomalies.1980-2012.nc"
Among these 3 inputs, it seems the wind anomalies are not correct because
when I try to calculate Conventional (covariance) univariate EOF analysis for time span 1995-1999 (as in the website) using http://www.ncl.ucar.edu/Applications/Scripts/mjoclivar_12.ncl, the result of OLR is close to the website, but for U850 and U200 is different and significant different for EOF-3 (enclosed). Thus, I think my wind anomalies is not correctly calculated.
I calculated wind anomalies from daily data as the code below (enclosed). I don’t know whether the way to merge the files and then calculate anomaly from those files is correct or not. Probably you have suggestion and help for that.
Thanks you,
JoeKy
_______________________________________________
ncl-talk mailing list
List instructions, subscriber options, unsubscribe:
http://mailman.ucar.edu/mailman/listinfo/ncl-talk
This archive was generated by hypermail 2.1.8 : Wed Jun 06 2012 - 15:17:44 MDT