Date: Wed Jun 20 2012 - 14:04:41 MDT
Hello NCL-Talk,
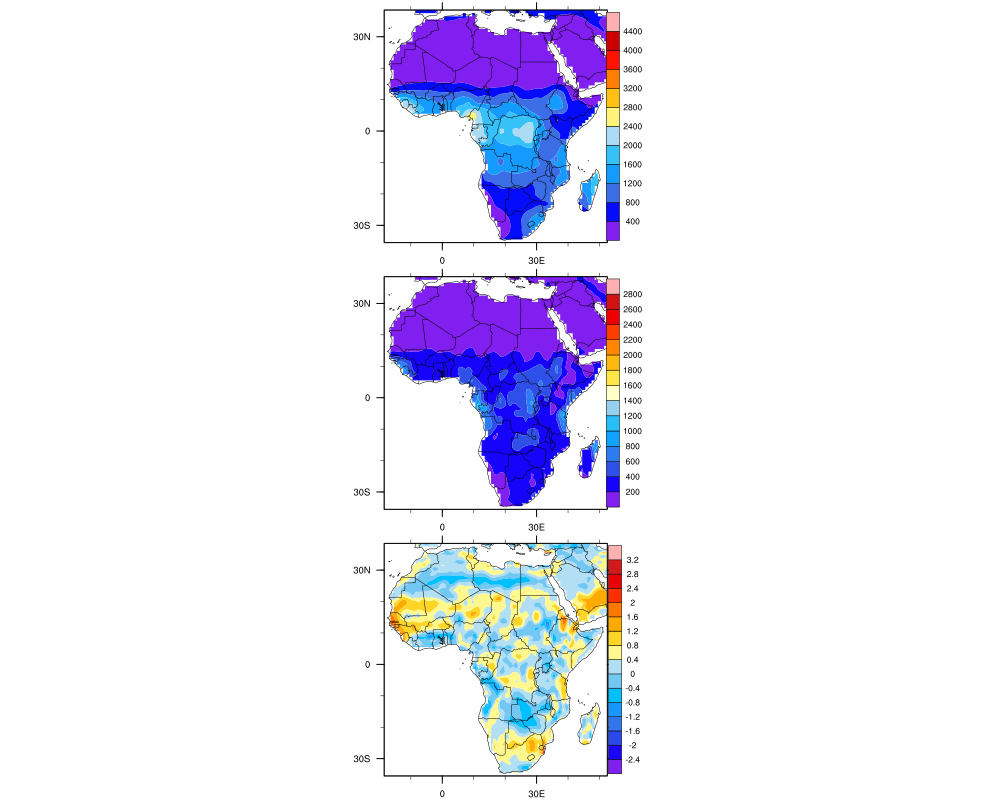
I created a plot that shows three statistics of an output spatially. The
analysis is done globally, but I specify a region of interest in the plot.
The legend is scaled to the max and min of the global values. I want to
change the scale to the regional values. For example, in the attached plot,
the max and min values in the legend are 400 and 4,000 whereas in the
region the max and min are 400 and 2,500.
Is there a way I can modify the plot resources and change the legend scale?
I have appended the plot resources part of the script.
Thanks,
--------------------------------------
wks = gsn_open_wks("png", diro + "annualAvg_precip_1971-2000")
plot = new(3, graphic)
statID = 0 ; takes values 0 (mean), 1 (std. dev) and 2 (skewness)
do plt=0,2
;------------- resource list for 1st plot
res1 = True
res1@gsnDraw = False
res1@gsnFrame = False
res1@gsnStringFontHeightF = 0.0125
res1@gsnSpreadColors = True
res1@lbOrientation = "Vertical"
res1@lbLabelFontHeightF = 0.02
res1@pmLabelBarOrthogonalPosF = -0.025
res1@lbLabelAutoStride = True
res1@gsnSpreadColors = True ; not needed in NCL v6.1.0
res1@cnFillOn = True
res1@cnLinesOn = False
res1@cnLineLabelsOn = False
;res1@mpCenterLonF = 26.0 ; center the map
arounf this lon.
res1@mpMinLatF = regBnds(1,0) ; select a
subregion
res1@mpMaxLatF = regBnds(1,1)
res1@mpMinLonF = regBnds(1,2)
res1@mpMaxLonF = regBnds(1,3)
res1@gsnAddCyclic = False
res1@mpFillOn = False
res1@mpOutlineBoundarySets = "National"
res1@mpPerimOn = True
res1@mpDataBaseVersion = "MediumRes"
res1@DataSetName = "Earth..4"
res1@mpOceanFillColor = 1
res1@gsnPaperOrientation = "auto"
res1@gsnMaximize = True
;plot(plt) = gsn_csm_contour_map_ce(wks, lonFlip(Pstats(statID,:,:)),
res1)
plot(plt) = gsn_csm_contour_map_ce(wks, lonFlip(x(statID,:,:)), res1)
statID = statID + 1
end do
pres = True ; Set panel resources.
pres@gsnPanelLabelBar = False ; Turn on panel labelbar.
;pres@lbLabelStride = 2 ; print every label marker
;pres@lbLabelFontHeightF = 0.010 ; label font height
pres@gsnFrame = False ; do not advance the frame
gsn_panel(wks,plot,(/3,1/),pres)
frame(wks)
------------------------------------------------------------------------------------------------------------
_______________________________________________
ncl-talk mailing list
List instructions, subscriber options, unsubscribe:
http://mailman.ucar.edu/mailman/listinfo/ncl-talk