Date: Fri Jun 29 2012 - 09:13:27 MDT
First off, thanks as always to the NCAR staff for being so responsive to
our questions and maintaining this fantastic tool for us! Hopefully you've
been making it through the heat and fires safely...
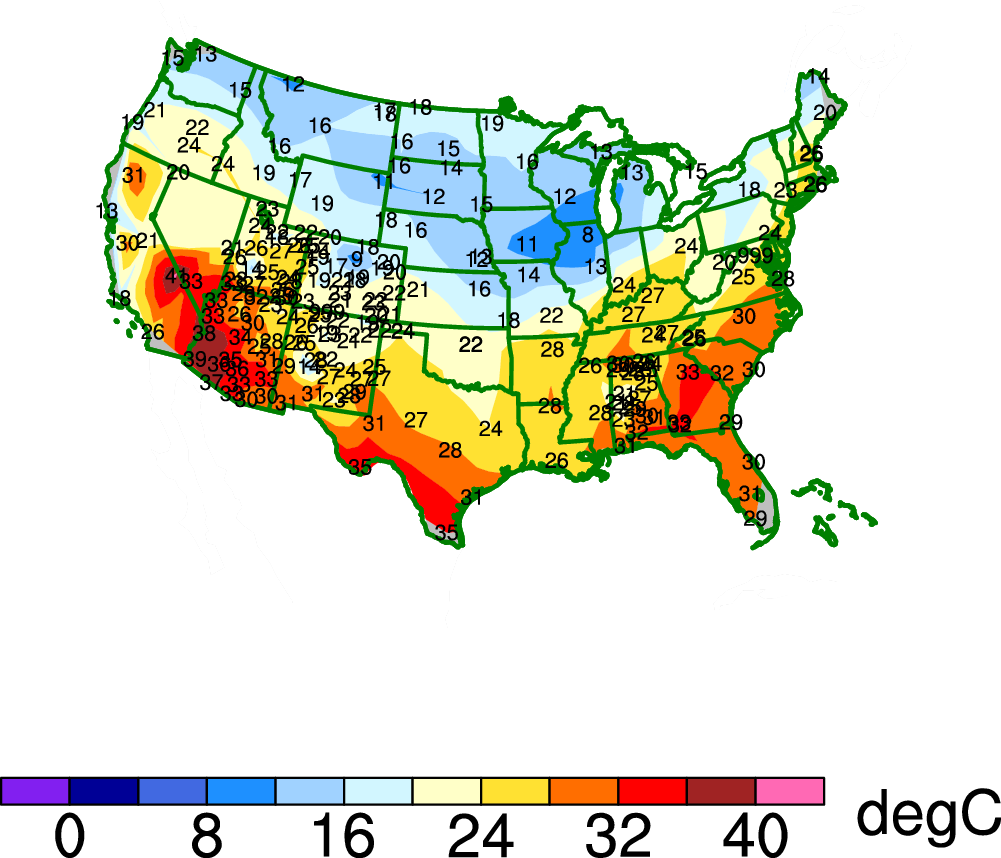
I'm trying to draw contours of station data (see attached code, data, and
image). The dataset I'm using does not extend all the way to the coasts,
hence the missing values (gray) in southern Florida, eastern Maine,
southern California, etc.
I understand that NCL doesn't want to interpolate beyond the data, but has
anyone developed a workaround for that? I'm considering padding it with
artificial/interpolated data beyond the borders or the map. But I wanted to
ask the community if they've tried anything else.
Thanks!
Carl
--
Carl J. Schreck III, PhD
Postdoctoral Research Associate
Cooperative Institute for Climate and Satellites (CICS-NC)
North Carolina State University and NOAA's National Climatic Data Center
151 Patton Avenue
Asheville, NC 28801
Tel: 828-257-3140
carl@cicsnc.org
http://monitor.cicsnc.org/mjo/
http://www.atmos.albany.edu/student/carl/
_______________________________________________
ncl-talk mailing list
List instructions, subscriber options, unsubscribe:
http://mailman.ucar.edu/mailman/listinfo/ncl-talk