Date: Thu Jun 28 2012 - 18:06:59 MDT
Hi NCL,
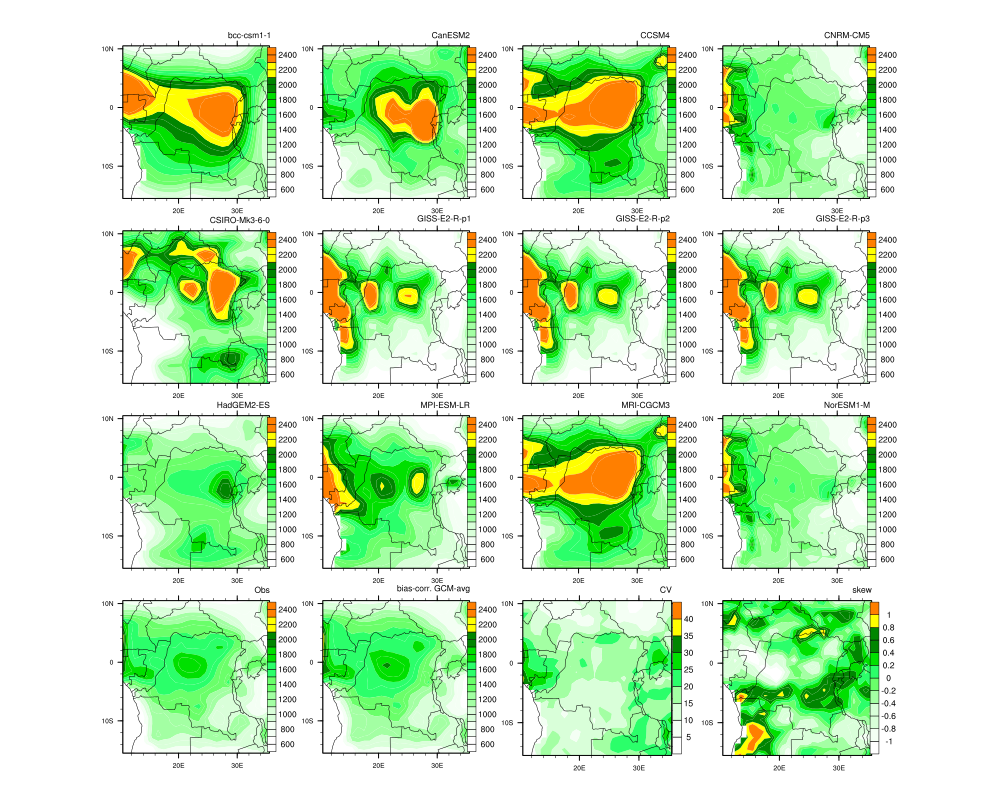
I created a panel plot with 16 plots (figure attached). I want to
(a) include a single legend for the first three rows and the same legend
for the first two plots in the last row
(b) change the colormap for the last two plot in the last row to a
different color scheme.
(c) I get a warning message after each plot as below,
warning:DataSetName is not a valid resource in xxxx_contour at this
time <- not sure why I get this?
My attempts so far have not yielded the required results.
I appreciate you help on this. The portion of the script is appended below,
;*******************************************************************
wks = gsn_open_wks("png", diro + "annualAvg_precip_AllGCMs_1971-2000")
plot = new(16, graphic)
colors = (/ (/255,255,255/),(/0,0,0/),(/255,255,255/), (/244,255,244/), \
(/217,255,217/), (/163,255,163/), (/106,255,106/), \
(/43,255,106/), (/0,224,0/), (/0,134,0/),(/255,255,0/),\
(/255,127,0/) /) * 1.0
colors = colors/255.
gsn_define_colormap(wks, colors)
centerlon = (regBnds(ireg,2) + regBnds(ireg,3)) / 2 ; center the map
around this longitude
;------------- resource list for 1st plot
res1 = True
res1@gsnDraw = False
res1@gsnFrame = False
res1@gsnPaperOrientation = "auto"
res1@gsnMaximize = True
res1@gsnStringFontHeightF = 0.0125
res1@gsnSpreadColors = True
res1@lbOrientation = "Vertical"
res1@lbLabelFontHeightF = 0.03
res1@pmLabelBarOrthogonalPosF = -0.025
res1@lbLabelAutoStride = True
res1@gsnSpreadColors = True
res1@cnFillOn = True
res1@cnLinesOn = False
res1@cnLineLabelsOn = False
res1@mpCenterLonF = centerlon ; center the
map around this lon.
res1@mpMinLatF = regBnds(ireg,0) ; select a
subregion
res1@mpMaxLatF = regBnds(ireg,1)
res1@mpMinLonF = regBnds(ireg,2)
res1@mpMaxLonF = regBnds(ireg,3)
res1@gsnAddCyclic = False
res1@mpFillOn = False
res1@mpOutlineBoundarySets = "National"
res1@mpPerimOn = True
res1@mpDataBaseVersion = "MediumRes"
res1@DataSetName = "Earth..4"
res1@mpOceanFillColor = 1
do i=0,11
res1@cnLevelSelectionMode = "ManualLevels"
res1@cnMinLevelValF = 600
res1@cnMaxLevelValF = 2400
res1@cnLevelSpacingF = 100
res1@gsnRightStringFontHeightF = 0.03
res1@gsnRightString = gcm_names(i)
; advance the plot
plot(i) = gsn_csm_contour_map_ce(wks,Pann7100(0,i,:,:), res1)
end do
res1@gsnRightString = "Obs"
res1@gsnRightStringFontHeightF = 0.03
plot(12) = gsn_csm_contour_map_ce(wks,Pann7100_obs,res1)
res1@gsnRightString = "bias-corr. GCM-avg"
plot(13) = gsn_csm_contour_map_ce(wks,Pannstats_bc(0,:,:),res1)
delete([/res1@cnLevelSelectionMode,res1@cnMinLevelValF
,res1@cnMaxLevelValF,res1@cnLevelSpacingF/])
delete(res1@cnLevels)
res1@cnLevelSelectionMode = "ExplicitLevels"
res1@cnLevels = (/5,10,15,20,25,30,35,40/)
res1@gsnRightString = "CV"
res1@gsnRightStringFontHeightF = 0.03
plot(14) = gsn_csm_contour_map_ce(wks,Pannstats_bc(1,:,:),res1)
delete(res1@cnLevels)
delete([/res1@cnLevelSelectionMode,res1@cnMinLevelValF
,res1@cnMaxLevelValF,res1@cnLevelSpacingF/])
res1@cnLevelSelectionMode = "ExplicitLevels"
res1@cnLevels =
(/-1.0,-0.8,-0.6,-0.4,-0.2,0,0.2,0.4,0.6,0.8,1.0/)
res1@gsnRightString = "skew"
res1@gsnRightStringFontHeightF = 0.03
plot(15) = gsn_csm_contour_map_ce(wks,Pannstats_bc(2,:,:),res1)
; advance to panel resources
pres = True ; Set panel resources.
pres@gsnPanelLabelBar = False ; Turn on panel labelbar.
pres@gsnFrame = False ; do not advance the frame
pres@gsnPanelRowSpec = True ; tell panel what order to plot
pres@gsnPanelCenter = False ; left-ligned plot
pres@gsnMaximize = True
gsn_panel(wks,plot,(/4,4,4,4/),pres)
frame(wks)
delete([/res1,pres,wks,plot/])
;*************************************************************************************************************
Noel
_______________________________________________
ncl-talk mailing list
List instructions, subscriber options, unsubscribe:
http://mailman.ucar.edu/mailman/listinfo/ncl-talk