Date: Mon Jul 23 2012 - 09:55:11 MDT
Hi there,
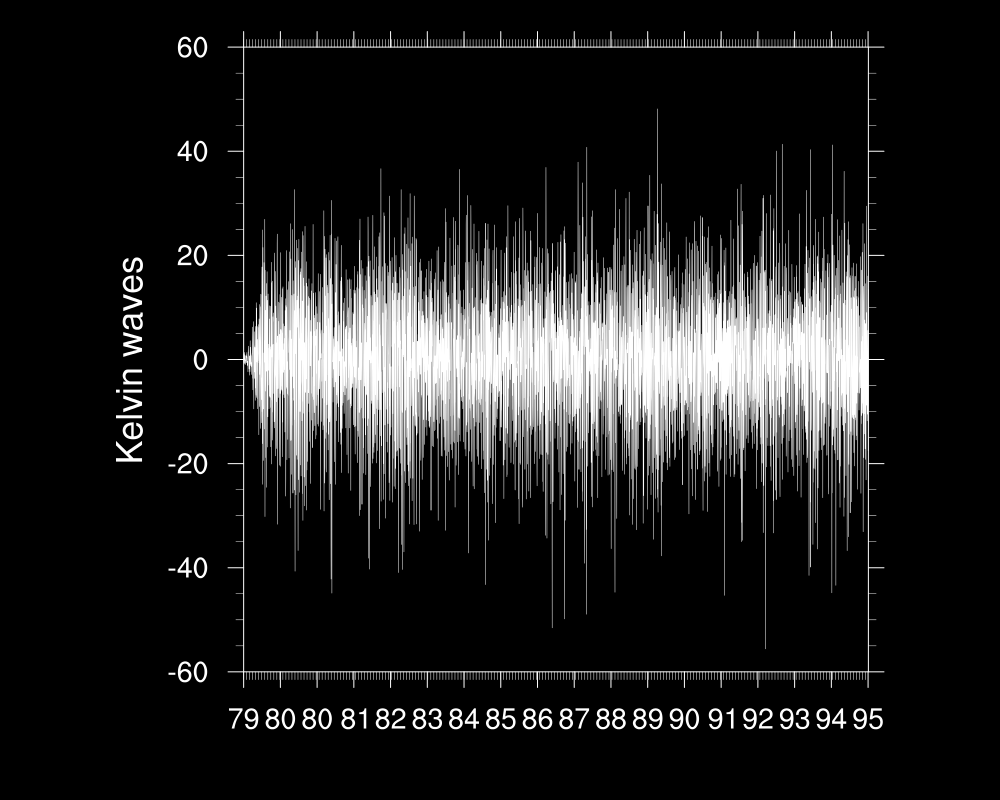
I am plotting a time series of kelvin wave variance built from NOAA OLR
data at a certain point in lat and lon, however, as this dataset contains
information for leap years, when I plot the x-axis (this is, the time
axis), this is out of phase (it can be seen in the attached figure with
365) and the values for years are repeated.
To plot the time axis I am using this code:
;*****************************************************
; Set special resources for the time axis
;*****************************************************
resTick = True
resTick@ttmFormat = "%y"
resTick@ttmAxis = "XB"
resTick@ttmMajorStride = 365
resTick@ttmMinorStride = 30
If I use the value of 366 instead, I have the second plot (366, -now the
years are not repeated but again everything is out of phase)
Do you know any other way to plot a "nice" and correct time axis whenever
we consider leap years?
Thank you very much.
Regards
Victor Torres
_______________________________________________
ncl-talk mailing list
List instructions, subscriber options, unsubscribe:
http://mailman.ucar.edu/mailman/listinfo/ncl-talk