Date: Fri Jul 20 2012 - 09:46:14 MDT
Hi NCL,
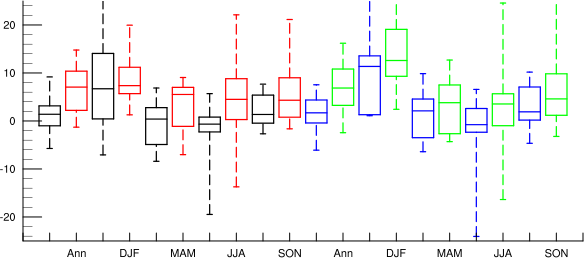
I created a box plot comparing annual and seasonal changes in precipitation
projections (plot attached).
I want to know if I can fill the boxes red and green. What is the plot
resource that does this?
I also want to draw a box around {black and red} and {blue and green}
boxes, so that they are grouped together for increased emphasis.
The relevant code section is attached.
Thanks in advance for your help,
;***************************************************************************
patSeasons = (/0,1,2,3,4,5,6,7,8,9,10,11,12,13,14,15,16,17,18,19/)
wks = gsn_open_wks(type,diro + "pr_change_2150_boxplot") ;
create postscript file
;------------ resources for plot background
res =
True ; plot mods
desired
res@tmXBLabels = (/" ","Ann"," ","DJF"," ","MAM"," ","JJA"," ","SON",\
" ","Ann"," ","DJF"," ","MAM"," ","JJA","
","SON"/) ; labels for each box, Jan-Dec
res@tmXBLabelFontHeightF = 0.01
res@trYMinF = -25.0
res@trYMaxF = 25.0
res@vpHeightF = 0.3
res@vpWidthF = 0.7
;------------ resources for polylines that draws the boxes
llres = True
llres@gsLineThicknessF = 2.5 ; line thickness
;------------ resources that control color and width of boxes
opti = True
opti@boxWidth = .8 ; Width of box (x
opti@boxColors =
(/"black","red","black","red","black","red","black","red","black","red",\
"blue","green","blue","green","blue","green","blue","green","blue","green"/)
plot = boxplot(wks,patSeasons,patArrSeason,opti,res,llres)
draw(wks)
frame(wks)
;*****************************************************************************
_______________________________________________
ncl-talk mailing list
List instructions, subscriber options, unsubscribe:
http://mailman.ucar.edu/mailman/listinfo/ncl-talk