Date: Thu Aug 09 2012 - 09:32:08 MDT
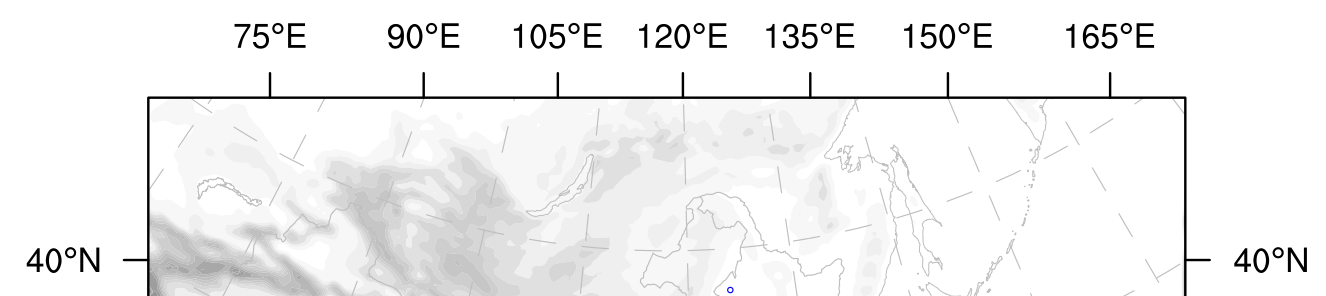
Hello,how to turn off the tickmark on the top and left side when using the resource "@pmTickMarkDisplayMode = "Always" "?
Figure can be seen forn attachment. Below is my script:
-----------------------my script begin-------------------------------------------------------
load "$NCARG_ROOT/lib/ncarg/nclscripts/csm/gsn_code.ncl"load "$NCARG_ROOT/lib/ncarg/nclscripts/csm/gsn_csm.ncl"
begin
; open wrfout file verdir = getenv("VERIF_DIR") fname = systemfunc("csh -c 'ls "+verdir+"/2011060100/*'") inp = addfiles(fname,"r") lat = inp[0]->XLAT lon = inp[0]->XLONG
; open geo file gdir = "$HOME/data/aer_proj/fix/" gname = systemfunc("ls "+gdir+"geo_em.d01.nc") ginp = addfile(gname,"r") lat2d = ginp->XLAT_M(0,:,:) lon2d = ginp->XLONG_M(0,:,:) dims = dimsizes(lat2d)
; open graphics file wks = gsn_open_wks("pdf","mpsite") colors = (/"white","red","green","blue"/) gsn_merge_colormaps(wks,"gsdtol",colors) gsn_reverse_colormap(wks) ;; gsn_draw_colormap(wks)
; set up some basic plot resources res = True res@gsnFrame = False res@gsnDraw = False res@tfDoNDCOverlay = True res@mpDataBaseVersion = "MediumRes" res@mpDataSetName = "Earth..4" res@mpDataResolution = "Coarsest" res@mpProjection = "LambertConformal" res@mpLambertParallel1F = ginp@TRUELAT1 res@mpLambertParallel2F = ginp@TRUELAT2 res@mpLambertMeridianF = ginp@STAND_LON res@mpLimitMode = "Corners" res@mpLeftCornerLatF = lat2d(0,0) res@mpLeftCornerLonF = lon2d(0,0) res@mpRightCornerLatF = lat2d(dims(0)-1,dims(1)-1) res@mpRightCornerLonF = lon2d(dims(0)-1,dims(1)-1) res@mpFillOn = False res@mpGridAndLimbOn = True res@mpGridSpacingF = 10. res@mpGridLineColor = "gray" res@mpGridLineDashPattern = 16 res@mpOutlineBoundarySets = "Geophysical" res@mpGeophysicalLineColor = "gray" res@mpGeophysicalLineThicknessF = .5 res@mpNationalLineColor = "gray" res@
mpNationalLineThicknessF = 1. res@mpOutlineSpecifiers = "China:states" res@mpUSStateLineColor = "gray" res@mpUSStateLineThicknessF = 1. res@pmTickMarkDisplayMode = "Always" cnres = res cnres@cnFillOn = True cnres@cnLinesOn = False cnres@cnLevelSelectionMode= "ManualLevels" cnres@cnMinLevelValF = 400 cnres@cnLevelSpacingF = 400 cnres@cnMaxLevelValF = 4800 cnres@gsnSpreadColors = True cnres@gsnSpreadColorStart = 1+dimsizes(colors) cnres@gsnSpreadColorEnd = 15+dimsizes(colors) cnres@lbTitleString = "Terrain Height (m)" cnres@lbTitleFontHeightF = .012 cnres@lbLabelStride = 1 cnres@lbLabelFontHeightF = .012 cnres@pmLabelBarWidthF = .55 cnres@pmLabelBarHeightF = .05 cnres@pmLabelBarOrthogonalPosF = .1 mkres = True mkres@gsMarkerIndex = 4 mkres@gsMarkerColor = "blue" mkres@gsMarkerSizeF = 4. mkres@gsMarkerThicknessF = 1. plres = True plres@gsnPanelTop = 1. plres@gsn
PanelBottom = 0. plres@gsnPanelBoxes = False plres@gsnPanelDebug = False plres@gsnPanelXWhiteSpacePercent = 3 plres@gsnPanelYWhiteSpacePercent = 3
; make plot for base base = gsn_csm_contour_map(wks,(/ginp->HGT_M(0,:,:)/),cnres) dum = gsn_add_polymarker(wks,base,lon,lat,mkres) gsn_panel(wks,base,(/1,1/),plres)
end-----------------------my script end-------------------------------------------------------
Thanks for your help, Ziqiang
_______________________________________________
ncl-talk mailing list
List instructions, subscriber options, unsubscribe:
http://mailman.ucar.edu/mailman/listinfo/ncl-talk