Date: Mon Aug 06 2012 - 02:43:48 MDT
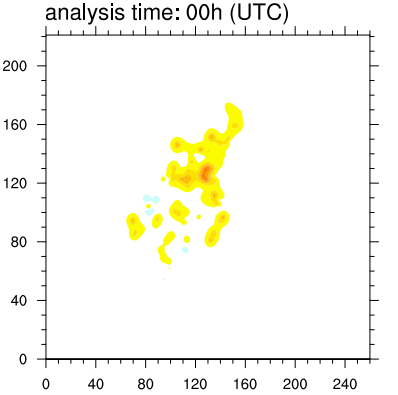
Hello,I am using gsn_csm_contour_map to plot a figure over map, but no map appeared and some warning info appeared.Could you help me? (bluefire system: cd /glade/home/zqjiang/scripts/verif.test and ./submit2.csh)
warning info:warning:mpProjection is not a valid resource in anl_contour_pm10inc_contour at this timewarning:mpLimitMode is not a valid resource in anl_contour_pm10inc_contour at this timewarning:mpLeftCornerLonF is not a valid resource in anl_contour_pm10inc_contour at this timewarning:mpRightCornerLonF is not a valid resource in anl_contour_pm10inc_contour at this timewarning:mpLeftCornerLatF is not a valid resource in anl_contour_pm10inc_contour at this timewarning:mpRightCornerLatF is not a valid resource in anl_contour_pm10inc_contour at this timewarning:mpLambertMeridianF is not a valid resource in anl_contour_pm10inc_contour at this time
warning:mpLambertParallel1F is not a valid resource in anl_contour_pm10inc_contour at this timewarning:mpLambertParallel2F is not a valid resource in anl_contour_pm10inc_contour at this timewarning:mpOutlineDrawOrder is not a valid resource in anl_contour_pm10inc_contour at this time
----------------------------------------------my script--------------------------------------------------------
load "$NCARG_ROOT/lib/ncarg/nclscripts/csm/gsn_code.ncl"load "$NCARG_ROOT/lib/ncarg/nclscripts/csm/gsn_csm.ncl"
begin
; open wrfout file PROJ_DIR = getenv("PROJ_DIR")+"/cyc6h_pmda/"+getenv("DATE_DIR")+"/" fnames_ges = systemfunc("csh -c 'ls "+PROJ_DIR+"*ges")+".nc" fnames_anl = systemfunc("csh -c 'ls "+PROJ_DIR+"*anl")+".nc" inp = addfiles(fnames_ges,"r") ges = inp[:]->PM10(:,0,:,:) inp = addfiles(fnames_anl,"r") anl = inp[:]->PM10(:,0,:,:) inc = anl-ges ;; inc = where(abs(inc).lt.0.01,0.,inc)
; open geo file gdir = "$HOME/data/aer_proj/fix/" gname = systemfunc("ls "+gdir+"geo_em.d01.nc") ginp = addfile(gname,"r") lat2d = ginp->XLAT_M(0,:,:) lon2d = ginp->XLONG_M(0,:,:) dims = dimsizes(lat2d)
; open graphics file wks = gsn_open_wks("pdf","anl_contour_pm10inc") gsn_define_colormap(wks,"nrl_sirkes")
; set up some basic plot resources res = True res@gsnFrame = False res@gsnDraw = False res@tfDoNDCOverlay = True res@mpDataBaseVersion = "MediumRes" res@mpDataSetName = "Earth..4" res@mpDataResolution = "Coarsest" res@mpProjection = "LambertConformal" res@mpLambertParallel1F = ginp@TRUELAT1 res@mpLambertParallel2F = ginp@TRUELAT2 res@mpLambertMeridianF = ginp@STAND_LON res@mpLimitMode = "Corners" res@mpLeftCornerLatF = lat2d(0,0) res@mpLeftCornerLonF = lon2d(0,0) res@mpRightCornerLatF = lat2d(dims(0)-1,dims(1)-1) res@mpRightCornerLonF = lon2d(dims(0)-1,dims(1)-1) res@mpFillOn = False res@mpGridAndLimbOn = True res@mpGridAndLimbDrawOrder = "Draw" res@mpGridSpacingF = 10. res@mpGridLineColor = "gray" res@mpGridLineDashPattern = 16 res@mpOutlineBoundarySets = "Geophysical" res@mpOutlineDrawOrder = "Draw" res@mpGeophysicalLineColor = "gray" res@mpG
eophysicalLineThicknessF = .5 res@mpNationalLineColor = "gray" res@mpNationalLineThicknessF = 1. res@mpOutlineSpecifiers = "China:states" res@mpUSStateLineColor = "gray" res@mpUSStateLineThicknessF = 1. cnres = res cnres@cnFillOn = True cnres@cnLinesOn = False cnres@cnLevelSelectionMode = "ManualLevels" cnres@cnMinLevelValF = -25 cnres@cnLevelSpacingF = 10 cnres@cnMaxLevelValF = 55 cnres@gsnSpreadColors = True cnres@gsnSpreadColorStart = 9 cnres@gsnSpreadColorEnd = 18 cnres@cnLineLabelsOn = False cnres@cnInfoLabelOn = False cnres@lbLabelBarOn = False cnres@gsnStringFontHeightF = .03 plres = True plres@gsnPanelTop = 1. plres@gsnPanelBottom = 0. plres@gsnPanelBoxes = False plres@gsnPanelDebug = False plres@gsnPanelXWhiteSpacePercent = 3 plres@gsnPanelYWhiteSpacePercent = 3 plres@gsnPanelLabelBar = True plres@lbTitleString = "PM10 (~F33~m~F21~g/m~S~3~N~)" plre
s@lbTitleFontHeightF= .012 plres@lbLabelFontHeightF= .012 plres@pmLabelBarWidthF = .45 plres@pmLabelBarHeightF = .05 plres@pmLabelBarOrthogonalPosF = -.02
; make some scatter plots base = new(4,graphic)
; 1) 00h ifig = 0 inc00 = dim_avg_n(inc(ifig::4,:,:),0)printVarSummary(inc00) cnres@gsnLeftString = "analysis time: "+inp[ifig]->Times(0,11:12)+"h (UTC)" base(ifig) = gsn_csm_contour_map(wks,(/inc00/),cnres) xx = gsn_csm_contour(wks,(/inc00/),cnres)draw(xx) frame(wks)----------------------------------------------my script--------------------------------------------------------
Thank you for help. Ziqiang
_______________________________________________
ncl-talk mailing list
List instructions, subscriber options, unsubscribe:
http://mailman.ucar.edu/mailman/listinfo/ncl-talk