Date: Thu Aug 16 2012 - 05:50:21 MDT
Hi all,
I have a plot problem concerning the ContourPlot Resources
'cnLevelSelectionMode'.
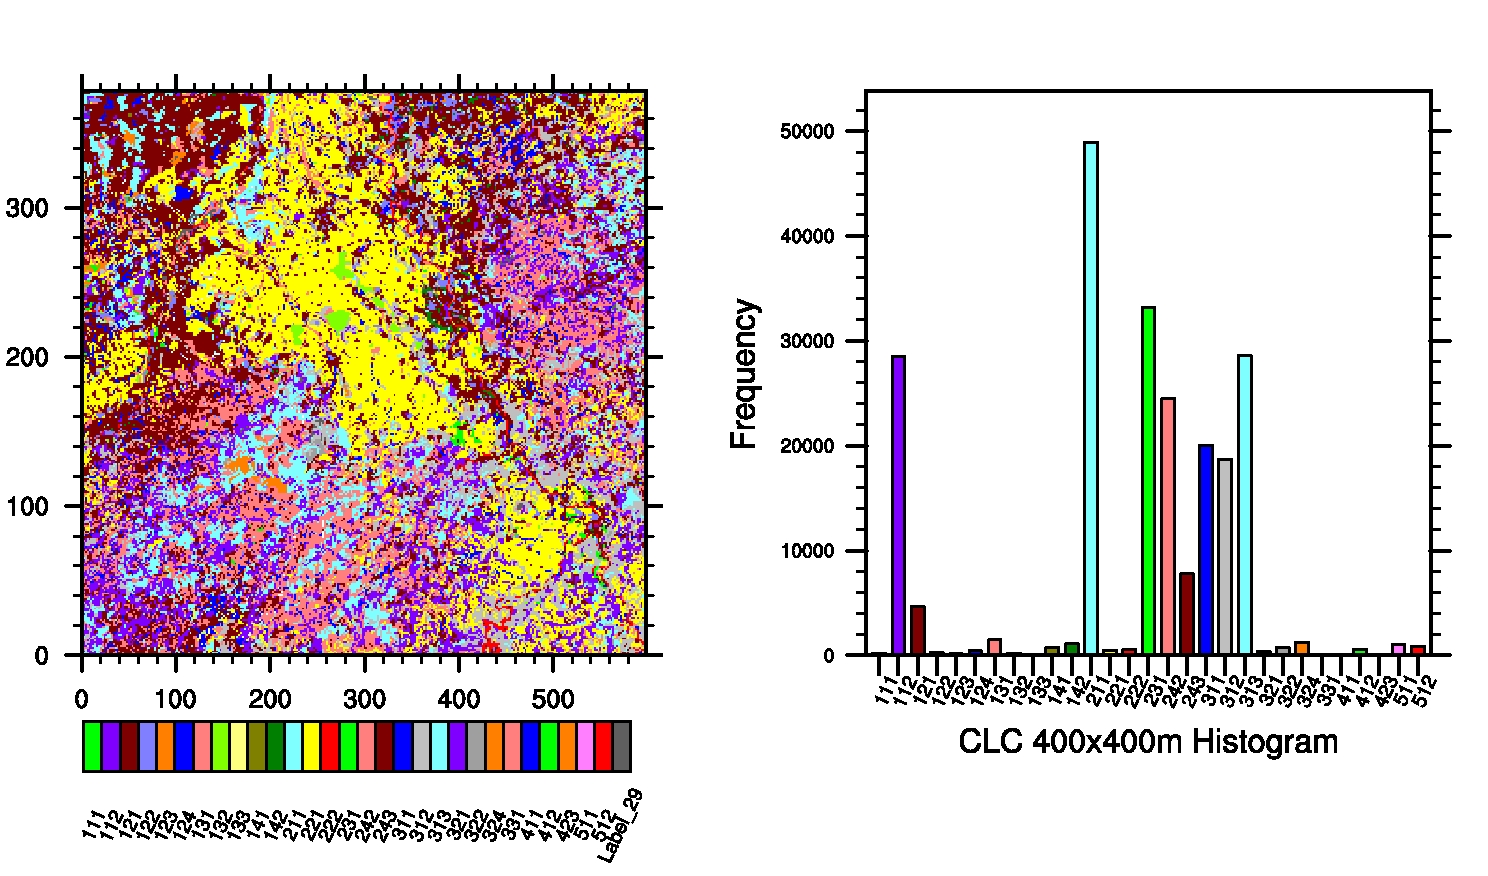
As you can see in the picutere (screenshot of wks_type = "ps"), I want to
have a contour plot of landuse data (integers). The problem is that somehow
a 30th value called 'Label_29' colored dark-grey is added to the labelbar
of the contourplot. That does not happen at the histogram-plot but though
this additional value, the data become shifted one position, wherefore the
histogram does not fit to the contourplot.
These are the resources for the contourplot:
res_clc@cnFillOn = True ; turn on
color
res_clc@cnFillMode = "RasterFill" ; much faster
to plot high res data
res_clc@cnLinesOn = False ; no contour
lines
res_clc@cnLineLabelsOn = False ; no line labels
res_clc@tmXBLabelStride = 1
res_clc@lbLabelAlignment = "BoxCenters"
res_clc@lbLabelStrings = clc_classes
res_clc@lbLabelAngleF = 65
res_clc@lbLabelFontHeightF = 0.015
res_clc@cnLevelSelectionMode = "ExplicitLevels" ; set manual
contour levels
res_clc@cnLevels = clc_classes
res_clc@cnFillColors = clc_colors
with
clc_classes =
(/111,112,121,122,123,124,131,132,133,141,142,211,221,222,231,242,243,311,312,313,321,322,324,331,411,412,423,511,512/)
; n = 29
clc_colors = (/"green", "purple", "brown", "SlateBlue", "orangered",
"blue", "palevioletred", "olivedrab2", \
"wheat", "OliveDrab","darkgreen", "skyblue2", "yellow", "red",
"green", \
"HotPink", "brown", "Blue", "LightGrey", "MediumTurquoise",
"purple" , \
"DarkSeaGreen", "Peru", "Tomato", "blue", "green", "orange",
"orchid", "red"/) ; n = 29
and
plot(0) = gsn_csm_contour(wks,data_clc(::-1,:),res_clc) ; 2d
plot(1) = gsn_histogram(wks,data_1d_clc,res_clc_hist) ; same data with
ndtooned() for this resource I use:
res_clc_hist@gsnHistogramDiscreteBinValues = clc_classes and
res_clc_hist@gsFillColor = clc_colors
I found out that 'Label_29' only appears when I use "BoxCenters" as
lblabelAlignment. If I use the default value for this resource, a 30th
color apperas but without the label 'Label_29'
Does anyone know how to fix this problem of plotting increasing values with
irregular gaps like 'clc_classes' ?
Thanks for any advice
Wish you a nice summer,
Chris
_______________________________________________
ncl-talk mailing list
List instructions, subscriber options, unsubscribe:
http://mailman.ucar.edu/mailman/listinfo/ncl-talk